

Question: Trend Analysis 4. Complete a trend analysis from the following data of Carter Corporation using 2019 as the base year. (Round to the nearest percent.)
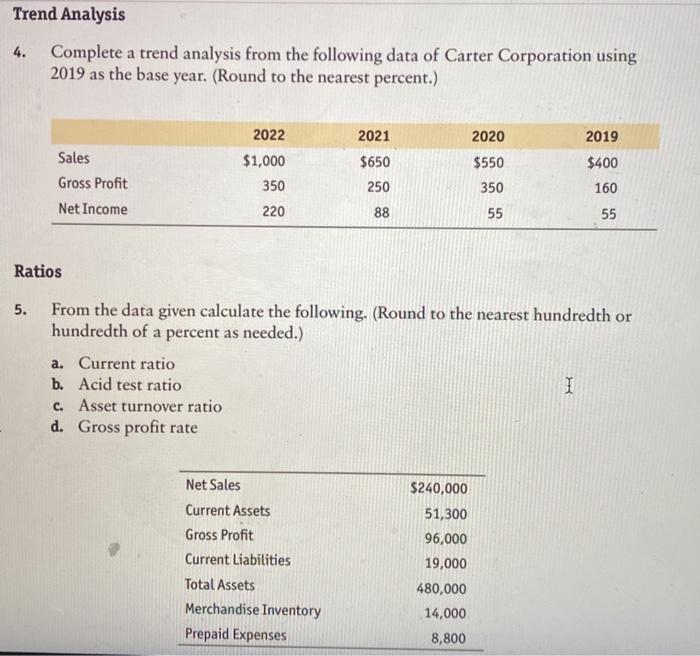
Trend Analysis 4. Complete a trend analysis from the following data of Carter Corporation using 2019 as the base year. (Round to the nearest percent.) 2021 2020 2019 Sales $650 $400 2022 $1,000 350 220 Gross Profit Net Income $550 350 55 250 88 160 55 Ratios 5. From the data given calculate the following. (Round to the nearest hundredth or hundredth of a percent as needed.) a. Current ratio b. Acid test ratio I C. Asset turnover ratio d. Gross profit rate Net Sales Current Assets Gross Profit Current Liabilities Total Assets Merchandise Inventory Prepaid Expenses $240,000 51,300 96,000 19,000 480,000 14,000 8,800
Step by Step Solution
There are 3 Steps involved in it
1 Expert Approved Answer
Step: 1 Unlock

Question Has Been Solved by an Expert!
Get step-by-step solutions from verified subject matter experts
Step: 2 Unlock
Step: 3 Unlock