

Question: TRIANGLE CO. PROFIT & LOSS STATEMENT Year 1 Year 2 39 SALES 696 737 40-COGS 339 336 41 GROSS PROFIT 357 401 42 -SGA 155
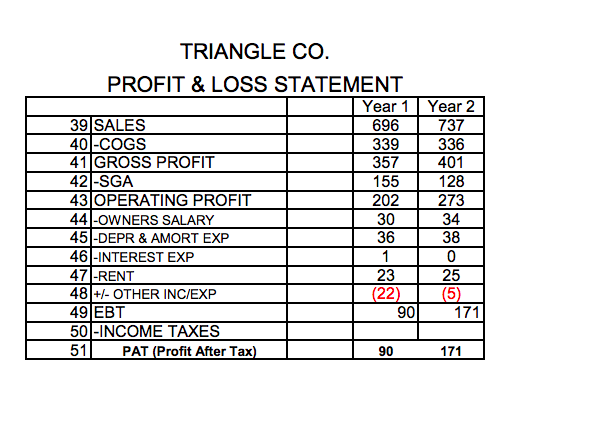
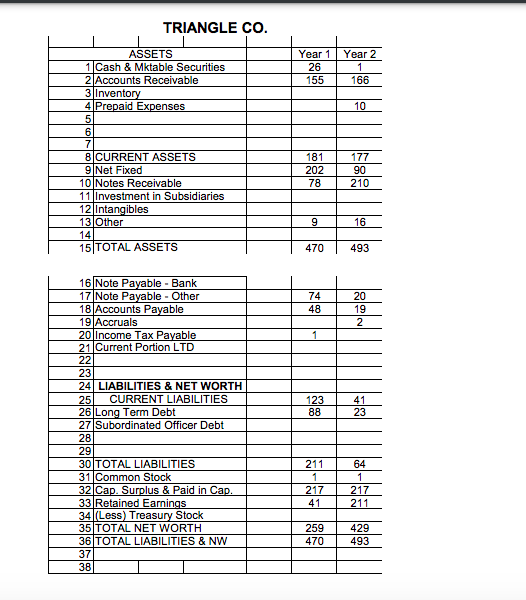
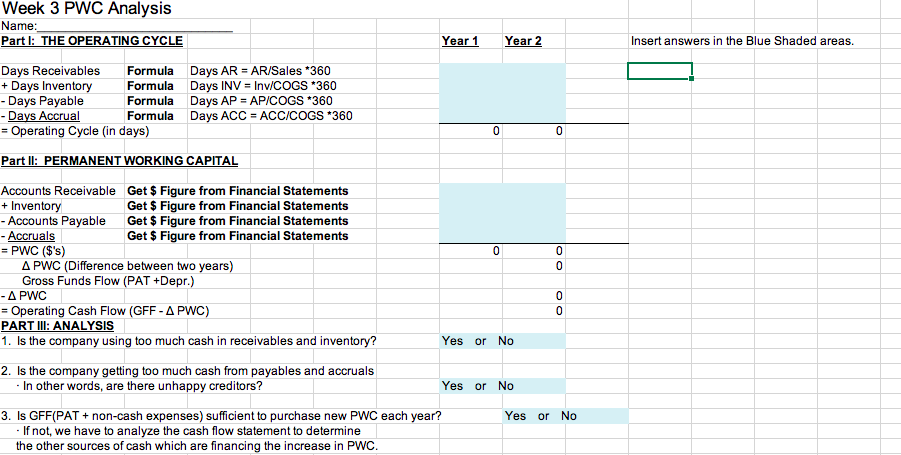
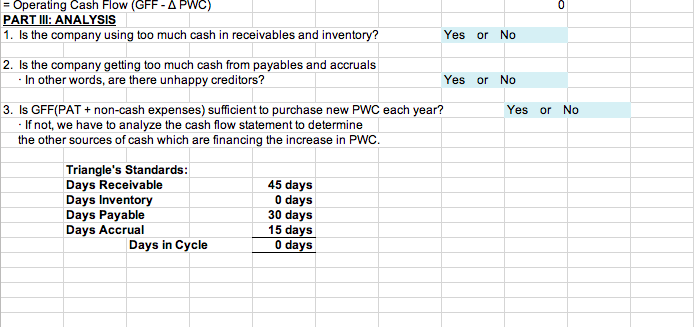
TRIANGLE CO. PROFIT & LOSS STATEMENT Year 1 Year 2 39 SALES 696 737 40-COGS 339 336 41 GROSS PROFIT 357 401 42 -SGA 155 128 43 OPERATING PROFIT 202 273 44 -OWNERS SALARY 30 34 45-DEPR & AMORT EXP 36 38 46-INTEREST EXP 1 0 47-RENT 23 25 48 +/- OTHER INC/EXP (22) 49 EBT 90 171 50 -INCOME TAXES 51 PAT (Profit After Tax) 90 171 (5) TRIANGLE CO. Year 1 26 155 Year 2 1 166 ASSETS 1 Cash & Mktable Securities 2 Accounts Receivable 3 Inventory 4 Prepaid Expenses 5 10 181 202 78 177 90 210 7 8 CURRENT ASSETS 9 Net Fixed 10 Notes Receivable 11 Investment in Subsidiaries 12 Intangibles 13 Other 14 15 TOTAL ASSETS 9 16 470 493 74 48 20 19 2 1 123 88 41 23 16 Note Payable - Bank 17 Note Payable - Other 18 Accounts Payable 19 Accruals 20 Income Tax Payable 21 Current Portion LTD 22 23 24 LIABILITIES & NET WORTH 25 CURRENT LIABILITIES 26 Long Term Debt 27 Subordinated Officer Debt 28 29 30 TOTAL LIABILITIES 31 Common Stock 32 Cap. Surplus & Paid in Cap. 33 Retained Earnings 34(Less) Treasury Stock 35 TOTAL NET WORTH 36 TOTAL LIABILITIES & NW 37 38 211 1 217 41 64 1 217 211 259 470 429 493 Week 3 PWC Analysis Name: Part I: THE OPERATING CYCLE Year 1 Year 2 Insert answers in the Blue Shaded areas. Days Receivables Formula Days AR = AR/Sales *360 + Days Inventory Formula Days INV = Inv/COGS *360 - Days Payable Formula Days AP - AP/COGS *360 - Days Accrual Formula Days ACC = ACC/COGS *360 = Operating Cycle (in days) Part II: PERMANENT WORKING CAPITAL 0 0 0 0 Accounts Receivable Get $ Figure from Financial Statements + Inventory Get $ Figure from Financial Statements - Accounts Payable Get $ Figure from Financial Statements - Accruals Get $ Figure from Financial Statements = PWC ($'s) A PWC (Difference between two years) Gross Funds Flow (PAT +Depr.) - PWC 0 = Operating Cash Flow (GFF-A PWC) 0 PART III: ANALYSIS 1. Is the company using too much cash in receivables and inventory? Yes or No 2. Is the company getting too much cash from payables and accruals . In other words, are there unhappy creditors? Yes or No 3. Is GFF(PAT + non-cash expenses) sufficient to purchase new PWC each year? Yes or No - If not, we have to analyze the cash flow statement to determine the other sources of cash which are financing the increase in PWC. 0 = Operating Cash Flow (GFF-A PWC) PART III: ANALYSIS 1. Is the company using too much cash in receivables and inventory? Yes or No 2. Is the company getting too much cash from payables and accruals - In other words, are there unhappy creditors? Yes or No 3. Is GFF(PAT + non-cash expenses) sufficient to purchase new PWC each year? Yes or No - If not, we have to analyze the cash flow statement to determine the other sources of cash which are financing the increase in PWC. Triangle's Standards: Days Receivable Days Inventory Days Payable Days Accrual Days in Cycle 45 days O days 30 days 15 days 0 days TRIANGLE CO. PROFIT & LOSS STATEMENT Year 1 Year 2 39 SALES 696 737 40-COGS 339 336 41 GROSS PROFIT 357 401 42 -SGA 155 128 43 OPERATING PROFIT 202 273 44 -OWNERS SALARY 30 34 45-DEPR & AMORT EXP 36 38 46-INTEREST EXP 1 0 47-RENT 23 25 48 +/- OTHER INC/EXP (22) 49 EBT 90 171 50 -INCOME TAXES 51 PAT (Profit After Tax) 90 171 (5) TRIANGLE CO. Year 1 26 155 Year 2 1 166 ASSETS 1 Cash & Mktable Securities 2 Accounts Receivable 3 Inventory 4 Prepaid Expenses 5 10 181 202 78 177 90 210 7 8 CURRENT ASSETS 9 Net Fixed 10 Notes Receivable 11 Investment in Subsidiaries 12 Intangibles 13 Other 14 15 TOTAL ASSETS 9 16 470 493 74 48 20 19 2 1 123 88 41 23 16 Note Payable - Bank 17 Note Payable - Other 18 Accounts Payable 19 Accruals 20 Income Tax Payable 21 Current Portion LTD 22 23 24 LIABILITIES & NET WORTH 25 CURRENT LIABILITIES 26 Long Term Debt 27 Subordinated Officer Debt 28 29 30 TOTAL LIABILITIES 31 Common Stock 32 Cap. Surplus & Paid in Cap. 33 Retained Earnings 34(Less) Treasury Stock 35 TOTAL NET WORTH 36 TOTAL LIABILITIES & NW 37 38 211 1 217 41 64 1 217 211 259 470 429 493 Week 3 PWC Analysis Name: Part I: THE OPERATING CYCLE Year 1 Year 2 Insert answers in the Blue Shaded areas. Days Receivables Formula Days AR = AR/Sales *360 + Days Inventory Formula Days INV = Inv/COGS *360 - Days Payable Formula Days AP - AP/COGS *360 - Days Accrual Formula Days ACC = ACC/COGS *360 = Operating Cycle (in days) Part II: PERMANENT WORKING CAPITAL 0 0 0 0 Accounts Receivable Get $ Figure from Financial Statements + Inventory Get $ Figure from Financial Statements - Accounts Payable Get $ Figure from Financial Statements - Accruals Get $ Figure from Financial Statements = PWC ($'s) A PWC (Difference between two years) Gross Funds Flow (PAT +Depr.) - PWC 0 = Operating Cash Flow (GFF-A PWC) 0 PART III: ANALYSIS 1. Is the company using too much cash in receivables and inventory? Yes or No 2. Is the company getting too much cash from payables and accruals . In other words, are there unhappy creditors? Yes or No 3. Is GFF(PAT + non-cash expenses) sufficient to purchase new PWC each year? Yes or No - If not, we have to analyze the cash flow statement to determine the other sources of cash which are financing the increase in PWC. 0 = Operating Cash Flow (GFF-A PWC) PART III: ANALYSIS 1. Is the company using too much cash in receivables and inventory? Yes or No 2. Is the company getting too much cash from payables and accruals - In other words, are there unhappy creditors? Yes or No 3. Is GFF(PAT + non-cash expenses) sufficient to purchase new PWC each year? Yes or No - If not, we have to analyze the cash flow statement to determine the other sources of cash which are financing the increase in PWC. Triangle's Standards: Days Receivable Days Inventory Days Payable Days Accrual Days in Cycle 45 days O days 30 days 15 days 0 days
Step by Step Solution
There are 3 Steps involved in it

Get step-by-step solutions from verified subject matter experts