

Question: Type or paste question here Assumptions 10.0% 3.5% Annual Output (metric tons) New Output Gain on Old Output Maximum Possible Output Price/ton (dollars) Inflation (prices
 Type or paste question here
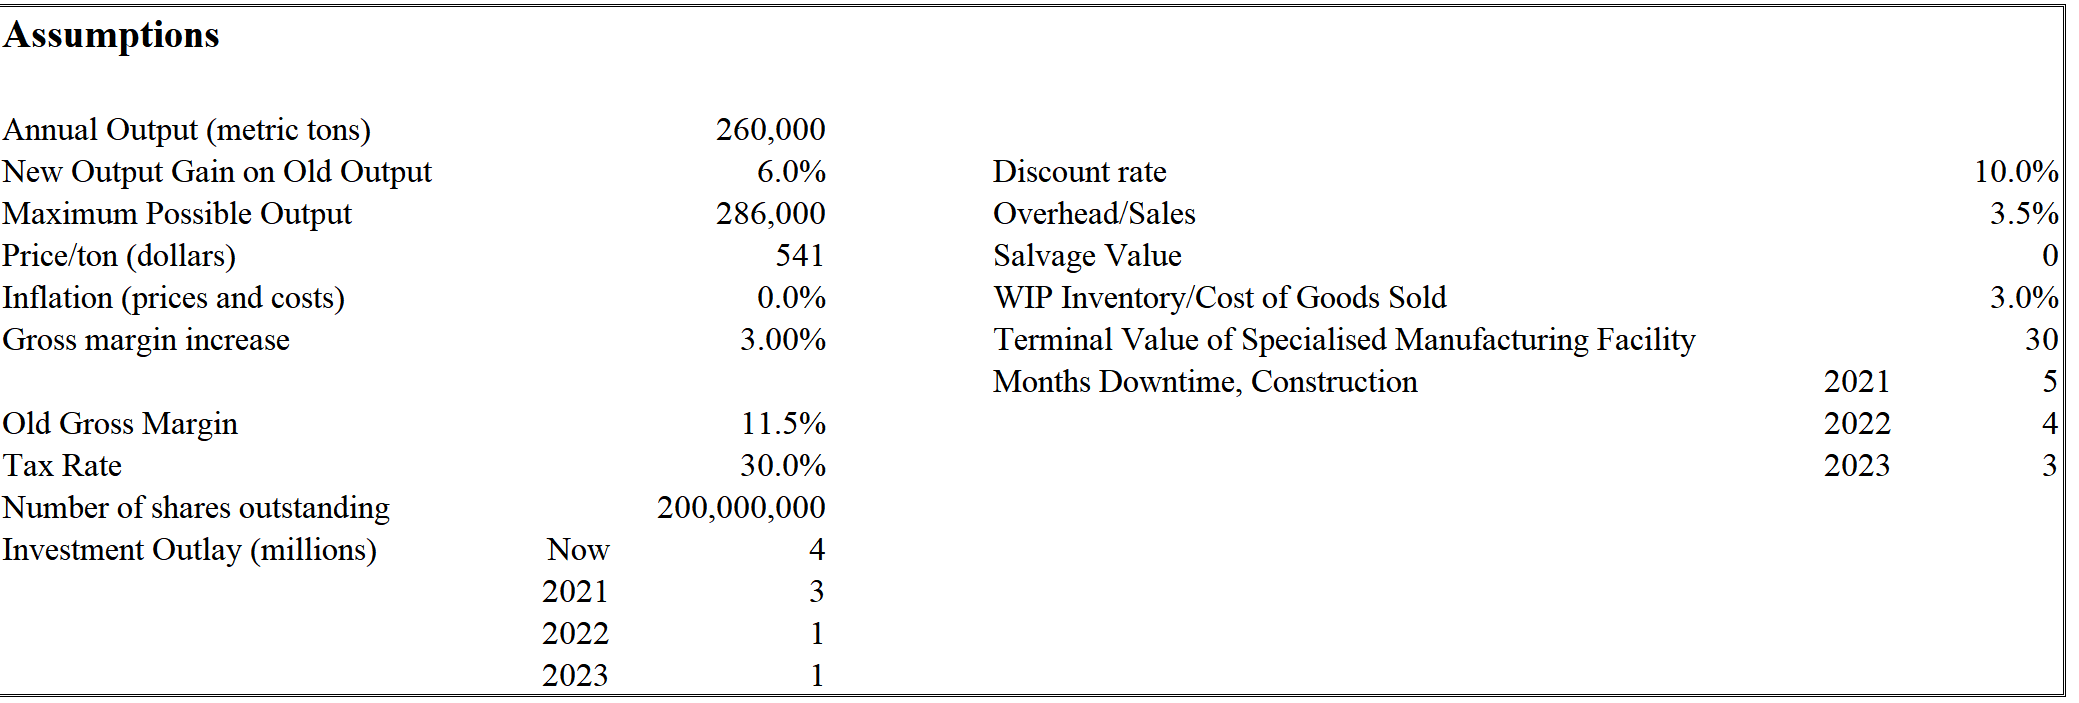
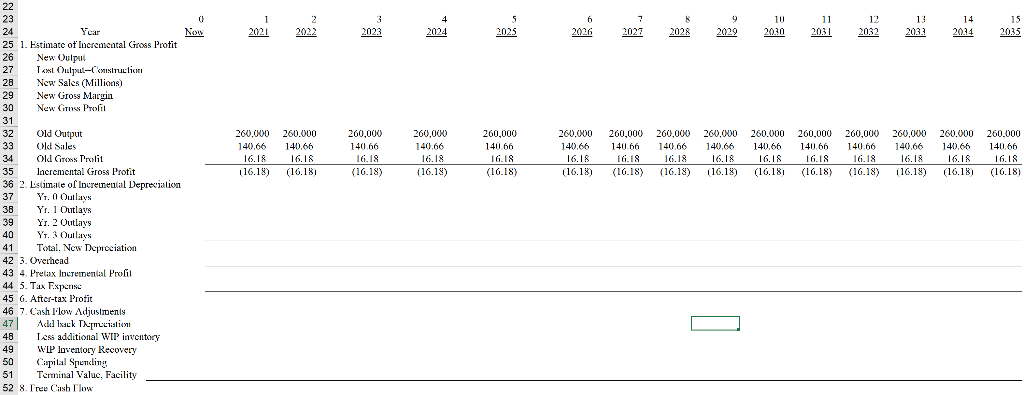
Assumptions 10.0% 3.5% Annual Output (metric tons) New Output Gain on Old Output Maximum Possible Output Price/ton (dollars) Inflation (prices and costs) Gross margin increase 260,000 6.0% 286,000 541 0.0% 3.00% Discount rate Overhead/Sales Salvage Value WIP Inventory/Cost of Goods Sold Terminal Value of Specialised Manufacturing Facility Months Downtime, Construction 2021 2022 2023 3.0% 30 5 4 3 Old Gross Margin Tax Rate Number of shares outstanding Investment Outlay (millions) Now 2021 2022 2023 11.5% 30.0% 200,000,000 4 3 1 1 2 1 2021 2022 3 2023 4 2024 2023 5 2025 6 2026 7 2027 9 2029 10 2030 11 2031 12 2032 13 2033 14 2034 15 2035 2028 260.000 140.66 16.18 116.18) 260.000 140.66 16.18 (16.18) 260,000 140.66 16.18 (16.18) 260.000 140.66 16.18 (16.18) 260,000 1411.66 16.18 (16.18) 260.000 140.66 16.IR (16.18) 260.000 1401.66 16.18 (16.18) 260.000 140.66 16.18 (16.18) 260.000 140.66 16.18 116.18) 260.000 140.66 16.IR (16.181 260,000 1401.66 16.18 (16.18) 260,000 140.66 16.18 (16.18) 260.COM 140.66 16.18 116.18) 260.000 140.66 16.IR (16.18) 260.000 140.66 16.18 (16.18) 22 23 0 24 Year Now 25 1. Estimate of Incremental Gross Profit 26 New Oulpui 27 TXL Opul--- Ciuction 28 New Sales (Millions) 29 New Gross Margin 30 New Cits Profil 31 32 Old Output 33 Old Sales Old Go Trolit 35 Incremental Gross Protit 36 2. Estimate of Incremental Depreciation 37 Yh. 0 Outlaws 38 Yr. 1 Outlaws 39 Yr. 2 Outlays 40 YT. 3 Outlays 41 Total, New Depreciation 42 3. Overhead 43 4. Prelax Incremental Profil 44 5. Tax Experise 45 6. After-tax Profit 46 7. Cash Flow Adjustments 471 47 Adid Ixick Test 48 Less additional WIP inventory 49 WIP loventory Recovery 50 Capital Sendling 51 Terminal Valuc, Facility 52 8. Tree Cash Flow 1 Assumptions 10.0% 3.5% Annual Output (metric tons) New Output Gain on Old Output Maximum Possible Output Price/ton (dollars) Inflation (prices and costs) Gross margin increase 260,000 6.0% 286,000 541 0.0% 3.00% Discount rate Overhead/Sales Salvage Value WIP Inventory/Cost of Goods Sold Terminal Value of Specialised Manufacturing Facility Months Downtime, Construction 2021 2022 2023 3.0% 30 5 4 3 Old Gross Margin Tax Rate Number of shares outstanding Investment Outlay (millions) Now 2021 2022 2023 11.5% 30.0% 200,000,000 4 3 1 1 2 1 2021 2022 3 2023 4 2024 2023 5 2025 6 2026 7 2027 9 2029 10 2030 11 2031 12 2032 13 2033 14 2034 15 2035 2028 260.000 140.66 16.18 116.18) 260.000 140.66 16.18 (16.18) 260,000 140.66 16.18 (16.18) 260.000 140.66 16.18 (16.18) 260,000 1411.66 16.18 (16.18) 260.000 140.66 16.IR (16.18) 260.000 1401.66 16.18 (16.18) 260.000 140.66 16.18 (16.18) 260.000 140.66 16.18 116.18) 260.000 140.66 16.IR (16.181 260,000 1401.66 16.18 (16.18) 260,000 140.66 16.18 (16.18) 260.COM 140.66 16.18 116.18) 260.000 140.66 16.IR (16.18) 260.000 140.66 16.18 (16.18) 22 23 0 24 Year Now 25 1. Estimate of Incremental Gross Profit 26 New Oulpui 27 TXL Opul--- Ciuction 28 New Sales (Millions) 29 New Gross Margin 30 New Cits Profil 31 32 Old Output 33 Old Sales Old Go Trolit 35 Incremental Gross Protit 36 2. Estimate of Incremental Depreciation 37 Yh. 0 Outlaws 38 Yr. 1 Outlaws 39 Yr. 2 Outlays 40 YT. 3 Outlays 41 Total, New Depreciation 42 3. Overhead 43 4. Prelax Incremental Profil 44 5. Tax Experise 45 6. After-tax Profit 46 7. Cash Flow Adjustments 471 47 Adid Ixick Test 48 Less additional WIP inventory 49 WIP loventory Recovery 50 Capital Sendling 51 Terminal Valuc, Facility 52 8. Tree Cash Flow 1
Step by Step Solution
There are 3 Steps involved in it

Get step-by-step solutions from verified subject matter experts