

Question: Use CTRL and scroll up with the mouse wheel to zoom in. Shares Outstandir 92,897,240 10.0% 30% 12.0 3 Assumptions 4 Annual Output (metric tons)
 Use CTRL and scroll up with the mouse wheel to zoom in.
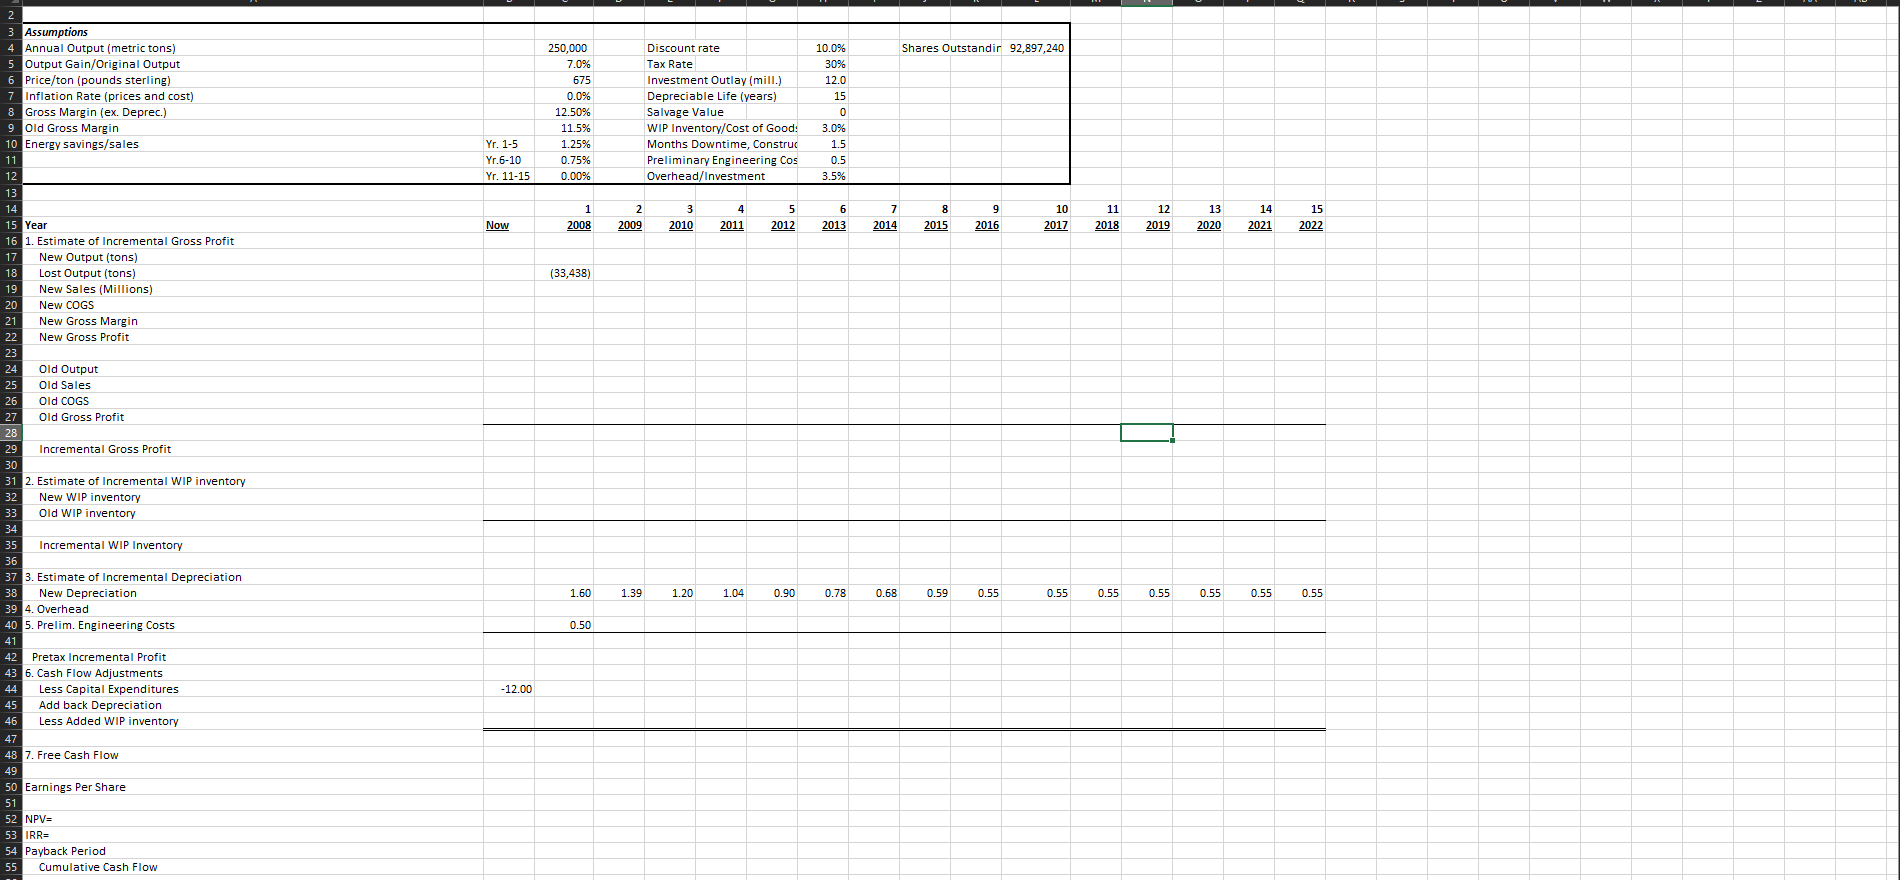
Shares Outstandir 92,897,240 10.0% 30% 12.0 3 Assumptions 4 Annual Output (metric tons) 5 Output Gain/Original Output 6 Price/ton (pounds sterling) 7 Inflation Rate (prices and cost) 8 Gross Margin (ex. Deprec.) 9 Old Gross Margin 10 Energy savings/sales 250,000 7.0% 675 0.0% 12.50% 11.5% 1.25% 0.75% 0.00% Discount rate Tax Rate Investment Outlay (mill.) Depreciable Life (years) Salvage Value WIP Inventory/Cost of Good: Months Downtime, Construc Preliminary Engineering Cos Overhead/Investment 3.0% 1.5 0.5 3.5% Yr. 1-5 Yr.6-10 Yr. 11-15 11 10 4 2011 5 2012 6 2013 9 2016 11 2018 12 2019 13 2020 14 2021 15 2022 Now 2008 2009 2010 2014 2015 2017 14 15 Year 16 1. Estimate of Incremental Gross Profit 17 New Output (tons) 18 Lost Output (tons) 19 New Sales (Millions) New COGS New Gross Margin 22 New Gross Profit (33,438) 20 N 24 Old Output 25 Old Sales 26 Old COGS 27 Old Gross Profit 28 Incremental Gross Profit 30 31 2. Estimate of Incremental WIP inventory 32 New WIP inventory 33 Old WIP inventory 35 Incremental WIP Inventory 1.60 1.39 1.20 1.04 0.90 0.78 0.68 0.59 0.55 0.55 0.55 0.55 0.55 0.55 0.55 37 3. Estimate of Incremental Depreciation 38 New Depreciation 39 4. Overhead 40 5. Prelim. Engineering Costs 0.50 Pretax Incremental Profit 43 6. Cash Flow Adjustments 44 Less Capital Expenditures 45 Add back Depreciation 46 Less Added WIP inventory -12.00 48 7. Free Cash Flow 49 50 Earnings Per Share 52 NPV= 53 IRR= 54 Payback Period 55 Cumulative Cash Flow Shares Outstandir 92,897,240 10.0% 30% 12.0 3 Assumptions 4 Annual Output (metric tons) 5 Output Gain/Original Output 6 Price/ton (pounds sterling) 7 Inflation Rate (prices and cost) 8 Gross Margin (ex. Deprec.) 9 Old Gross Margin 10 Energy savings/sales 250,000 7.0% 675 0.0% 12.50% 11.5% 1.25% 0.75% 0.00% Discount rate Tax Rate Investment Outlay (mill.) Depreciable Life (years) Salvage Value WIP Inventory/Cost of Good: Months Downtime, Construc Preliminary Engineering Cos Overhead/Investment 3.0% 1.5 0.5 3.5% Yr. 1-5 Yr.6-10 Yr. 11-15 11 10 4 2011 5 2012 6 2013 9 2016 11 2018 12 2019 13 2020 14 2021 15 2022 Now 2008 2009 2010 2014 2015 2017 14 15 Year 16 1. Estimate of Incremental Gross Profit 17 New Output (tons) 18 Lost Output (tons) 19 New Sales (Millions) New COGS New Gross Margin 22 New Gross Profit (33,438) 20 N 24 Old Output 25 Old Sales 26 Old COGS 27 Old Gross Profit 28 Incremental Gross Profit 30 31 2. Estimate of Incremental WIP inventory 32 New WIP inventory 33 Old WIP inventory 35 Incremental WIP Inventory 1.60 1.39 1.20 1.04 0.90 0.78 0.68 0.59 0.55 0.55 0.55 0.55 0.55 0.55 0.55 37 3. Estimate of Incremental Depreciation 38 New Depreciation 39 4. Overhead 40 5. Prelim. Engineering Costs 0.50 Pretax Incremental Profit 43 6. Cash Flow Adjustments 44 Less Capital Expenditures 45 Add back Depreciation 46 Less Added WIP inventory -12.00 48 7. Free Cash Flow 49 50 Earnings Per Share 52 NPV= 53 IRR= 54 Payback Period 55 Cumulative Cash Flow
Step by Step Solution
There are 3 Steps involved in it

Get step-by-step solutions from verified subject matter experts