

Question: Type or paste question here PE Diesen Bewe 1. From figure 1, state the entity entity relationships. 6. From Eure 2, what are the measurez
 Type or paste question here
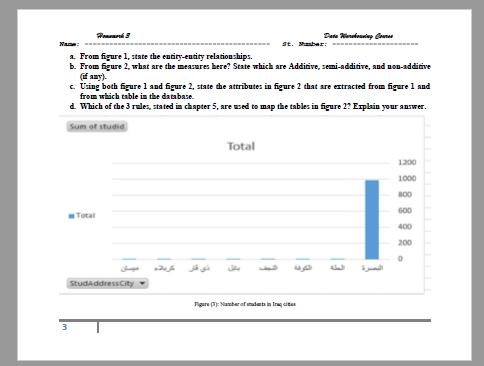
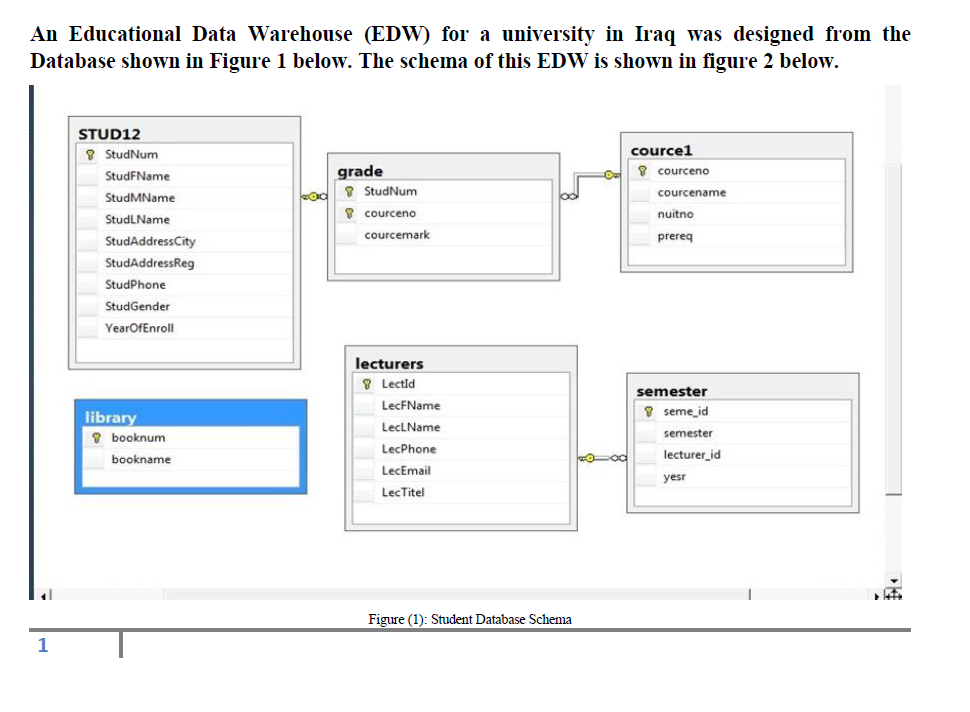
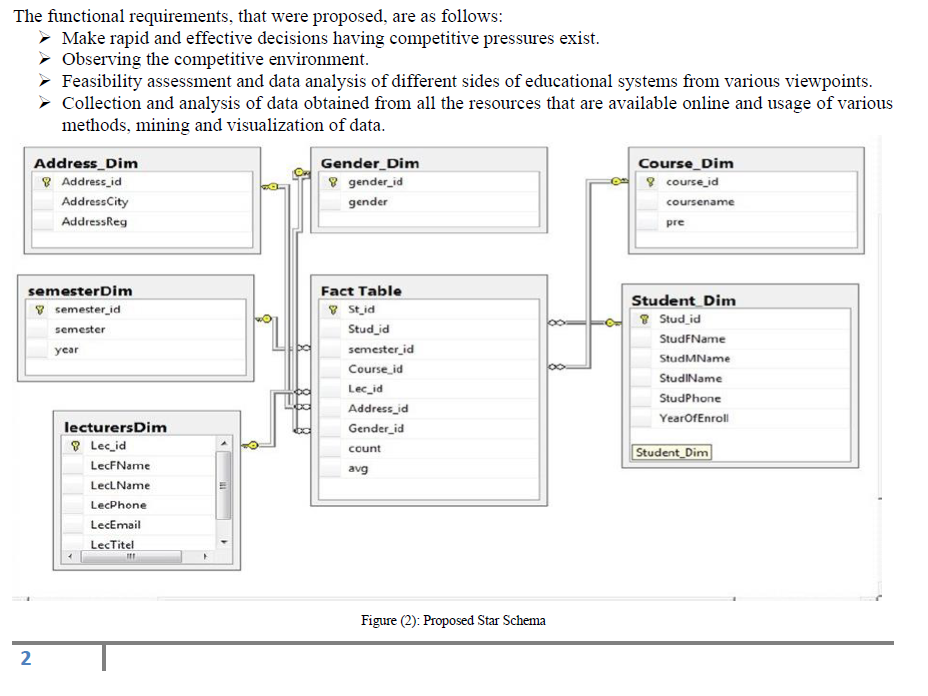
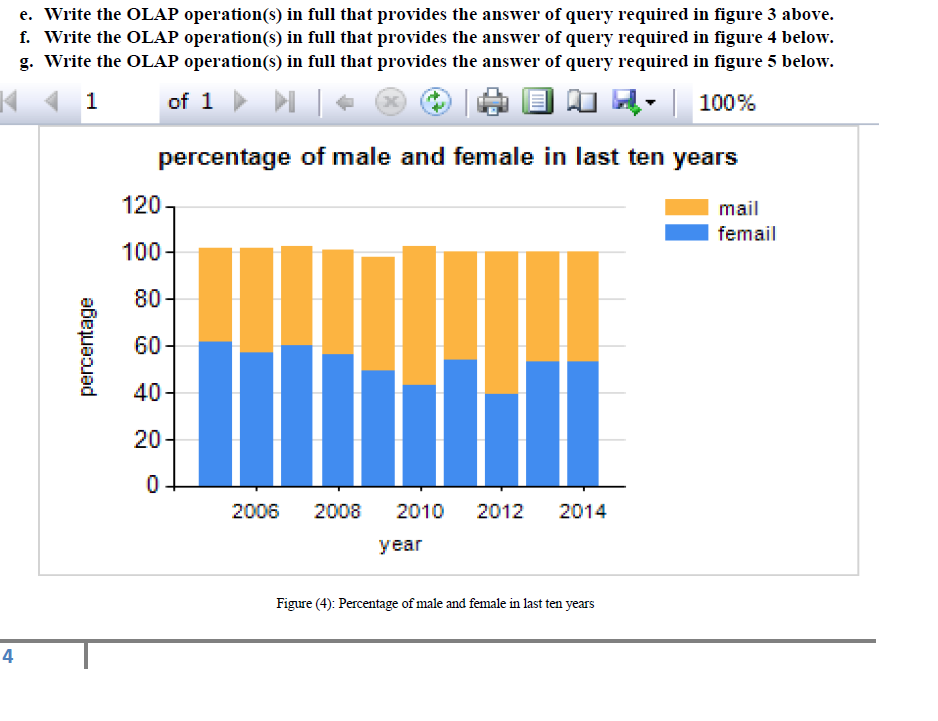
PE Diesen Bewe 1. From figure 1, state the entity entity relationships. 6. From Eure 2, what are the measurez bere? State which are Additive, semi-additive, and 100-additive Using both figure l and figure 2. state the attributes in figure 2 that are extracted from figure 1 and from which table in the database. d. Which of the rules, stated in chapter 5, are used to map the tables in figure 2? Explain your answer. Sum of studia Total 1200 1000 800 500 Total 400 200 0 13 StudAddress City Figure : Number of dents in ingles An Educational Data Warehouse (EDW) for a university in Iraq was designed from the Database shown in Figure 1 below. The schema of this EDW is shown in figure 2 below. cource1 9 courceno grade 9 StudNum 8 courceno courcename nuitno STUD12 StudNum StudFName StudMName StudLName StudAddress City StudAddressReg StudPhone StudGender YearOfEnroll courcemark prereq library 8 booknum bookname lecturers 8 Lectid LecFName LecLName LecPhone LecEmail LecTitel semester 9 seme id semester lecturer_id yesr 00 Figure (1): Student Database Schema The functional requirements, that were proposed, are as follows: Make rapid and effective decisions having competitive pressures exist. Observing the competitive environment. Feasibility assessment and data analysis of different sides of educational systems from various viewpoints. Collection and analysis of data obtained from all the resources that are available online and usage of various methods, mining and visualization of data. Address_Dim Address_id Address City AddressReg Gender_Dim 8 gender_id gender Course_Dim 8 course_id coursename pre semesterDim 8 semester_id semester year 8 Fact Table 8 St_id Stud_id semester_id Course_id Lec_id Address_id Gender_id count avg Student Dim Stud_id StudFName StudMName StudIName StudPhone YearOfEnroll Student_Dim lecturers Dim Lec_id LecFName Lech. Name LecPhone LecEmail LecTitel Figure (2): Proposed Star Schema 2 e. Write the OLAP operation(s) in full that provides the answer of query required in figure 3 above. f. Write the OLAP operation(s) in full that provides the answer of query required in figure 4 below. g. Write the OLAP operation(s) in full that provides the answer of query required in figure 5 below. K1 of 1 I - 100% percentage of male and female in last ten years 120 mail femail 100 80 percentage 60 40 20 0 2006 2008 2010 2012 2014 year Figure (4): Percentage of male and female in last ten years 4 Average of courcemark Total 75.5 75 74.5 [ Total 74 73.5 73 courceno Y Figure (5): Marks average of ca 201 and ca101. (In this case we compare average mark of two courses culture 201 and culture 101 during ten years.)
Step by Step Solution
There are 3 Steps involved in it

Get step-by-step solutions from verified subject matter experts