

Question: u gr... MEI AS Maths Data Assessment solutions Fig. 4b shows a box plot illustrating the median ages of the European countries Fig. 4b (d)

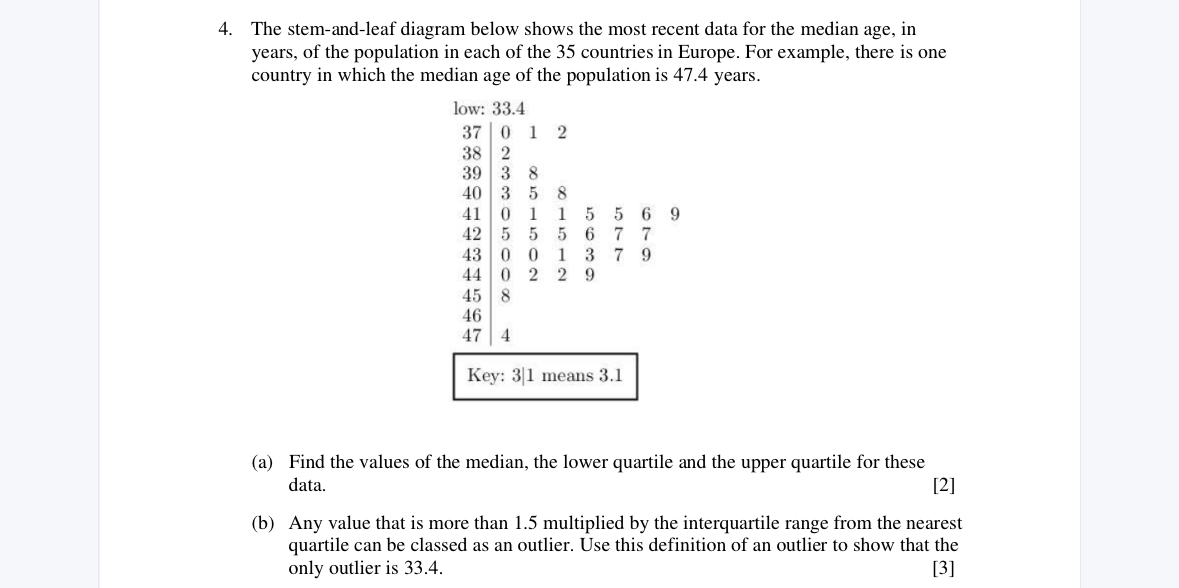
u gr... MEI AS Maths Data Assessment solutions Fig. 4b shows a box plot illustrating the median ages of the European countries Fig. 4b (d) On a copy of Fig. 4b, using the information given in Table 4a, draw a box plot for the median age in the Asian countries. [3] (e) Referring to the two box plots, make two comparisons between the data in the two regions. [2] (f) Calculate the values of the mean and the standard deviation for the Asian countries. [3] (g) An alternative definition of an outlier is a value that is more than 2 standard deviations from the mean. Show that this definition also makes Hong Kong an outlier. [2] Total 40 marks4. The stem-and-leaf diagram below shows the most recent data for the median age, in years, of the population in each of the 35 countries in Europe. For example, there is one country in which the median age of the population is 47.4 years. low 37 38 39 40 41 42 : 334 (0 2 3 3 0 5 0 4] = 4 N = T 00 NWOoo b b = O OO G 9 o -~ Key: 3|1 means 3.1 9 (a) Find the values of the median, the lower quartile and the upper quartile for these data. [2] (b) Any value that is more than 1.5 multiplied by the interquartile range from the nearest quartile can be classed as an outlier. Use this definition of an outlier to show that the only outlier is 33.4. (3]
Step by Step Solution
There are 3 Steps involved in it

Get step-by-step solutions from verified subject matter experts