

Question: Uniformly Accelerated Motion In One Dimension 1 Objective To experimentally study 1-dimension motion with uniform acceleration. 2 Overview The main idea of this experiment is

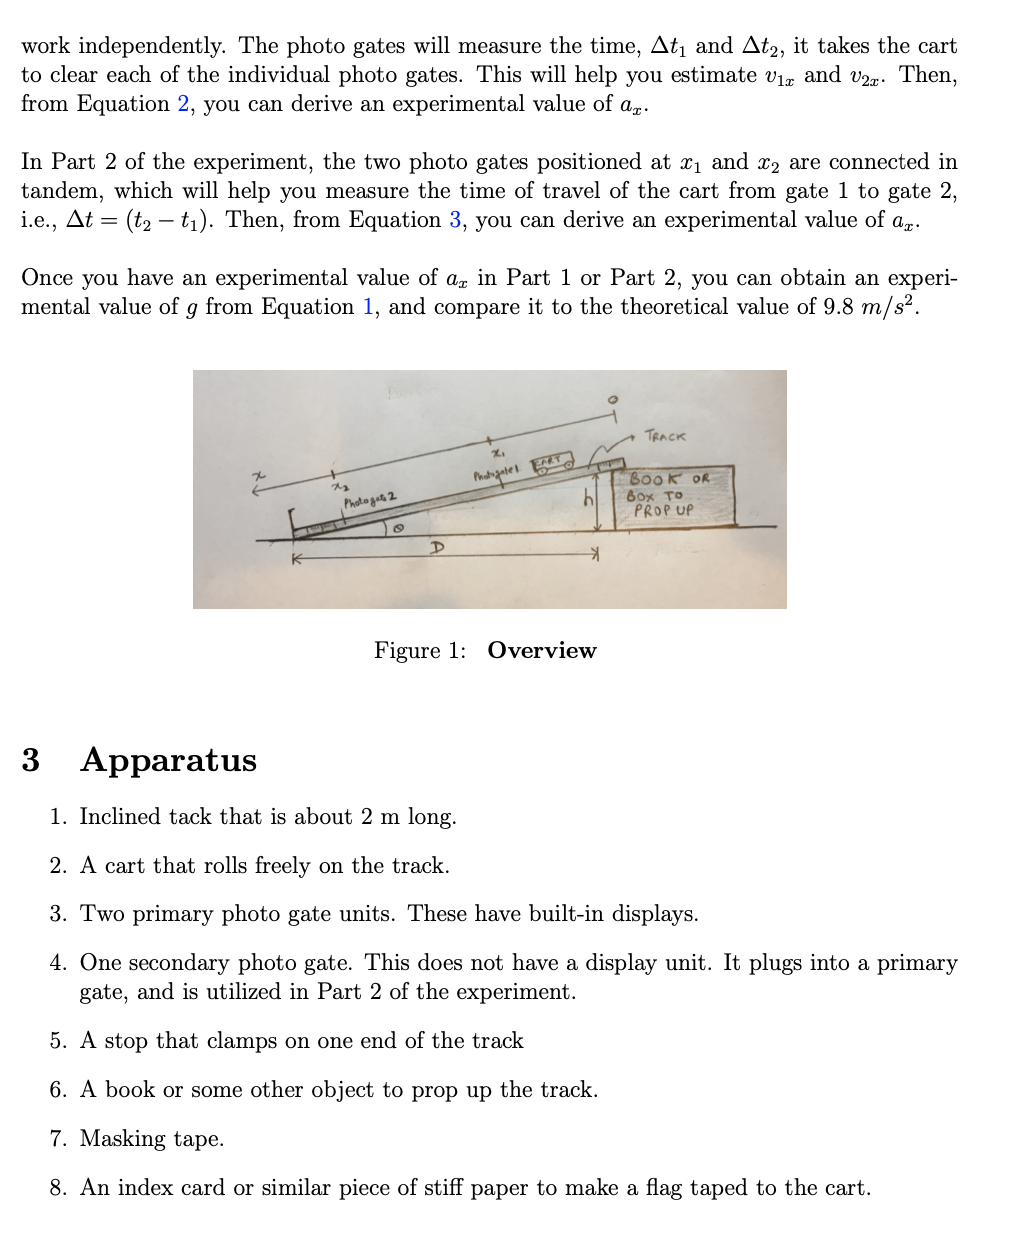
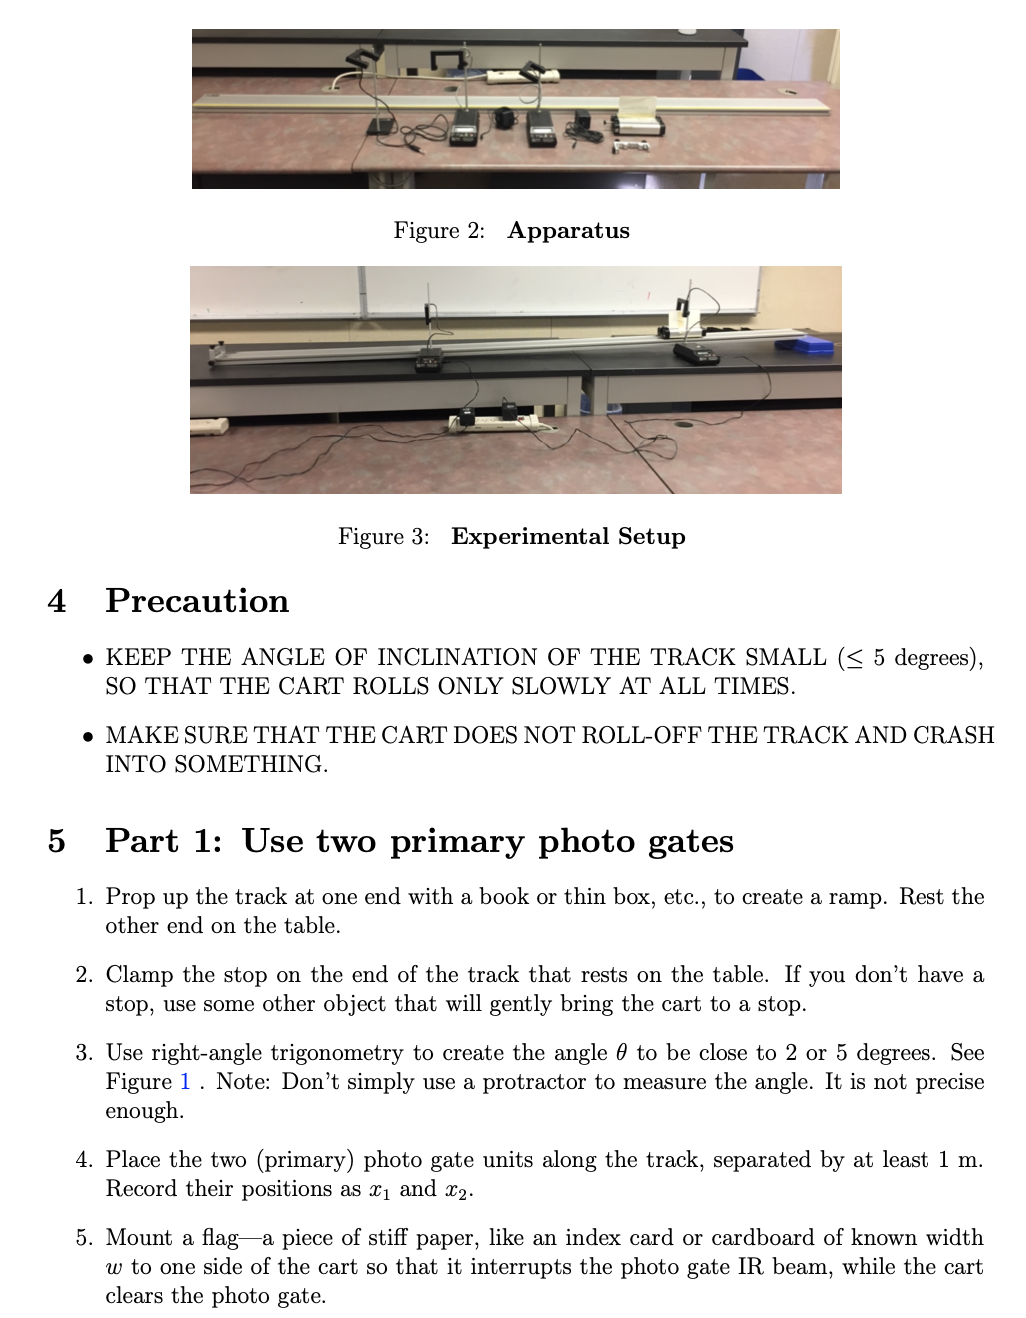


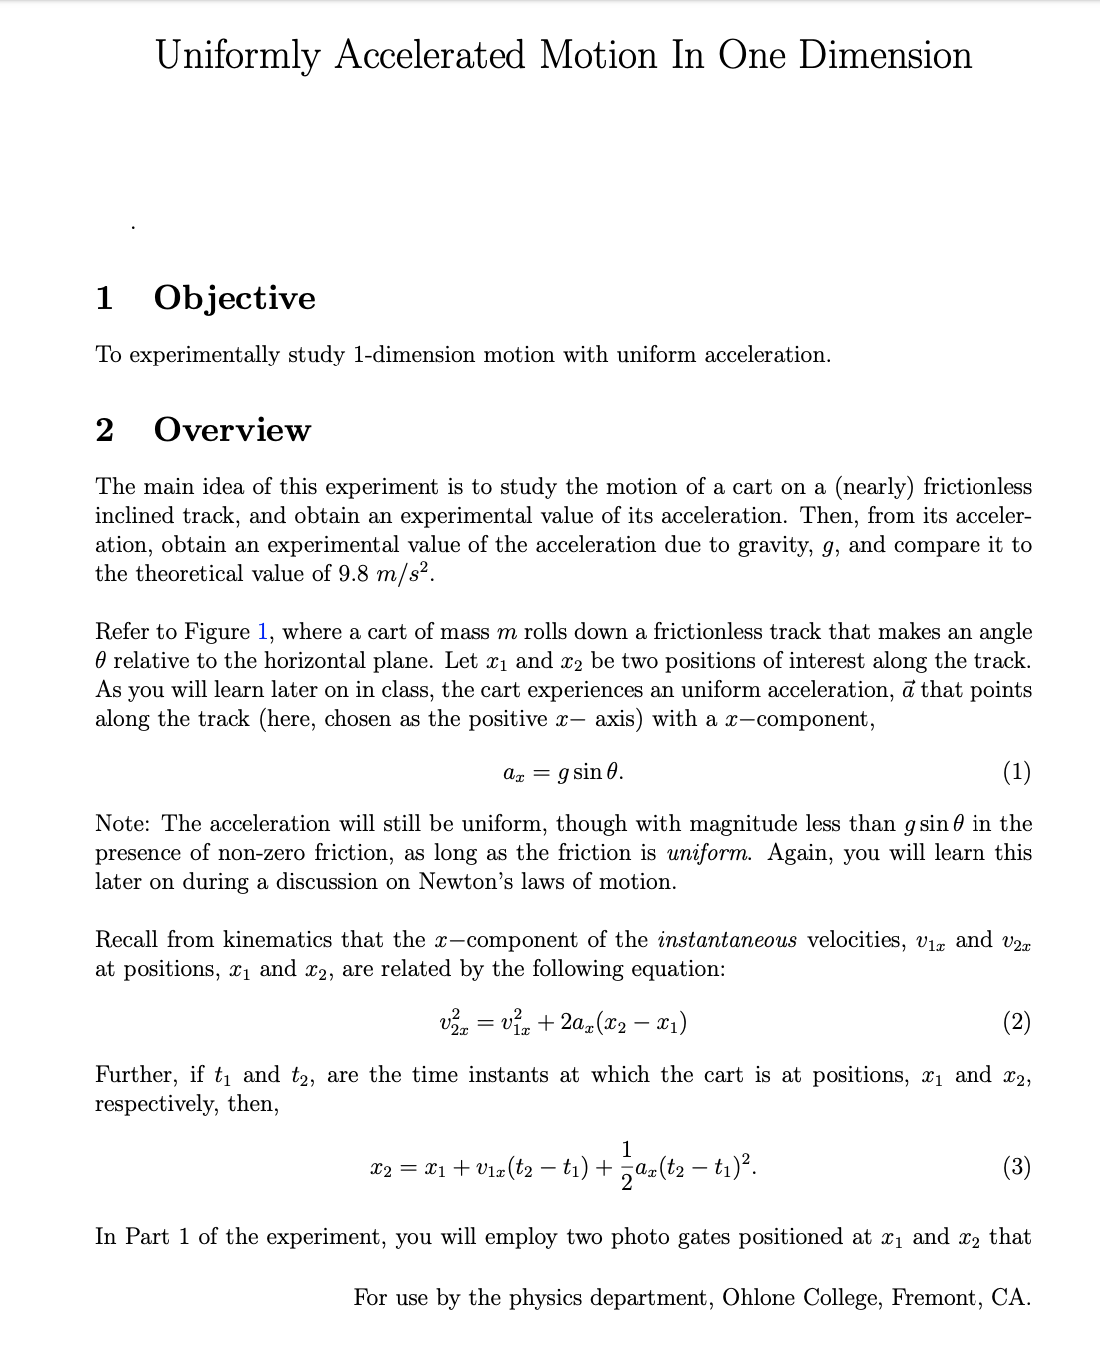


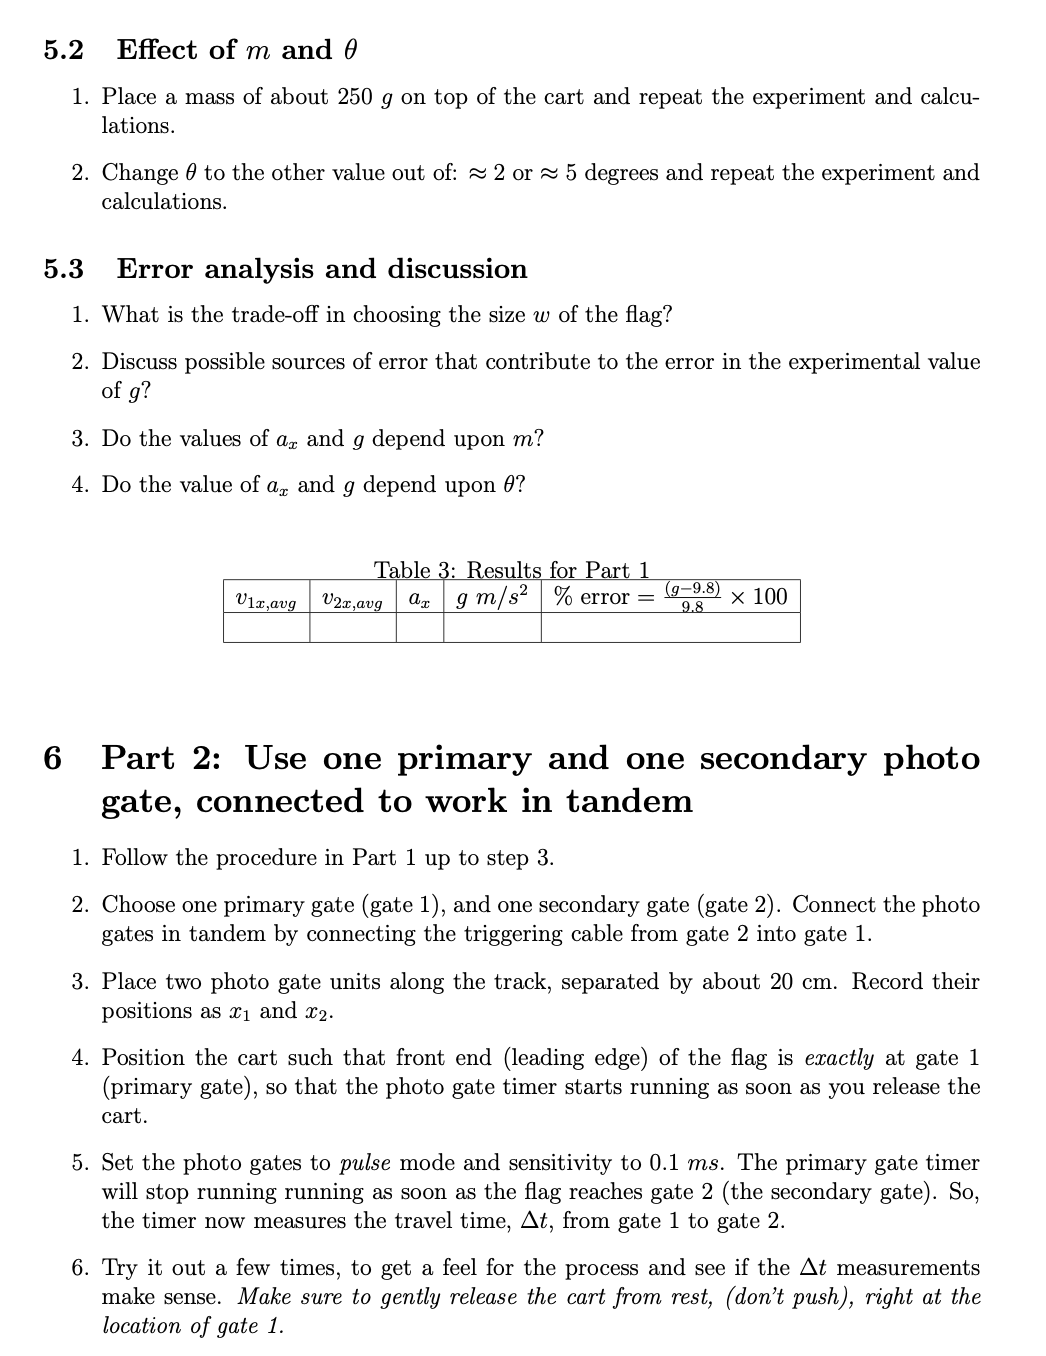
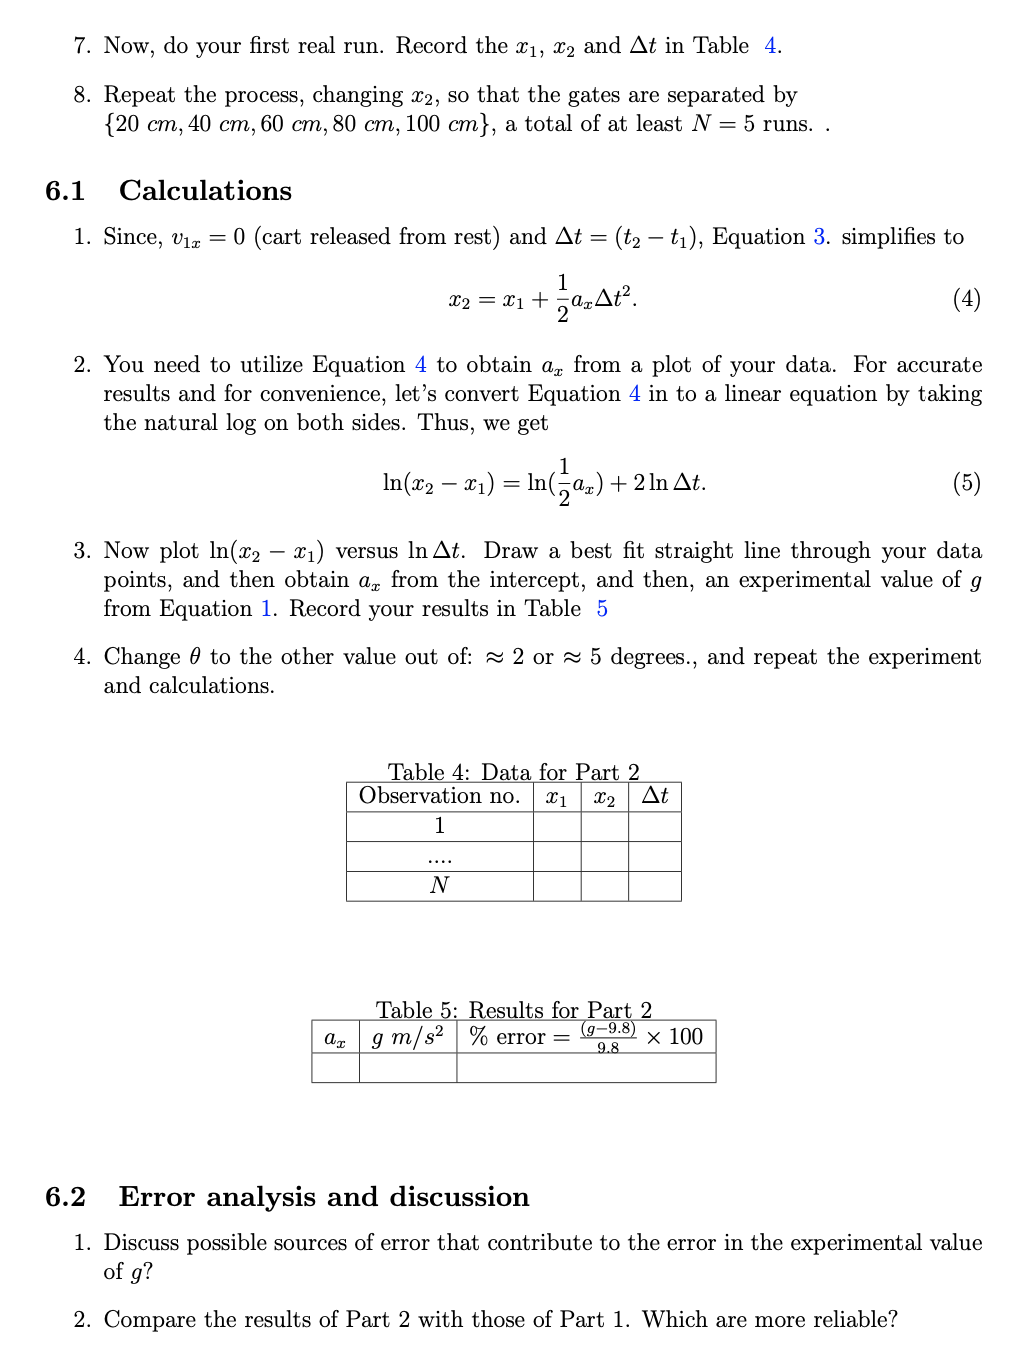

Uniformly Accelerated Motion In One Dimension 1 Objective To experimentally study 1-dimension motion with uniform acceleration. 2 Overview The main idea of this experiment is to study the motion of a cart on a (nearly) frictionless inclined track, and obtain an experimental value of its acceleration. Then, from its acceler- ation, obtain an experimental value of the acceleration due to gravity, 9, and compare it to the theoretical value of 9.8 m/sz. Refer to Figure 1, where a cart of mass m rolls down a frictionless track that makes an angle 9 relative to the horizontal plane. Let 3:1 and 332 be two positions of interest along the track. As you will learn later on in class, the cart experiences an uniform acceleration, (1' that points along the track (here, chosen as the positive :3 axis) with a mcomponent, aI = gsin. (1) Note: The acceleration will still be uniform, though with magnitude less than 9 sint'l in the presence of non-zero friction, as long as the friction is nntform. Again, you will learn this later on during a discussion on Newton's laws of motion. Recall from kinematics that the :rcomponent of the instantaneous velocities, U13 and 1:23 at positions, 3:1 and 3:2, are related by the following equation: \"3:1: : vi\": + 2.21032 _ 331) (2) Further, if t1 and t2, are the time instants at which the cart is at positions, :31 and 222, respectively, then, 1 $2 = 331 + 1'1sz 31) + zfta t1)2- (3) In Part 1 of the experiment, you will employ two photo gates positioned at 3:1 and 332 that For use by the physics department, Ohlone College, Fremont, CA. work independently. The photo gates will measure the time, A31 and Atg, it takes the cart to clear each of the individual photo gates. This will help you estimate v1, and 1:23. Then, from Equation 2, you can derive an experimental value of am. In Part 2 of the experiment, the two photo gates positioned at 2:1 and 1132 are connected in tandem, which will help you measure the time of travel of the cart from gate 1 to gate 2, Le, At = (t2 t1). Then, from Equation 3, you can derive an experimental value of am. Once you have an experimental value of La in Part 1 or Part 2, you can obtain an experi- mental value of g from Equation 1, and compare it to the theoretical value of 9.8 \"In/32. Figure 1: Overview 3 Apparatus 1. Inclined tack that is about 2 m long. 2. A cart that rolls freely on the track. 3. Two primary photo gate units. These have built-in displays. 4. One secondary photo gate. This does not have a display unit. It plugs into a primary gate, and is utilized in Part 2 of the experiment. 5. A stop that clamps on one end of the track . A book or some other object to prop up the track. . Masking tape. CID-10) . An index card or similar piece of stiff paper to make a ag taped to the cart. Figure 3: Experimental Setup 4 Precaution o KEEP THE ANGLE OF INCLINATION OF THE TRACK SMALL (3 5 degrees), SO THAT THE CART ROLLS ONLY SLOWLY AT ALL TIMES. 0 MAKE SURE THAT THE CART DOES NOT ROLL-OFF THE TRACK AND CRASH INTO SOMETHING. 5 Part 1: Use two primary photo gates 1. Prop up the track at one end with a book or thin box, etc., to create a ramp. Rest the other end on the table. 2. Clamp the stop on the end of the track that rests on the table. If you don't have a stop, use some other object that will gently bring the cart to a stop. 3. Use right-angle trigonometry to create the angle I9 to be close to 2 or 5 degrees. See Figure 1 . Note: Don't simply use a protractor to measure the angle. It is not precise enough. 4. Place the two (primary) photo gate units along the track, separated by at least 1 m. Record their positions as 3:1 and 2:2. 5. Mount a aga piece of stiff paper, like an index card or cardboard of known width to to one side of the cart so that it interrupts the photo gate IR beam, while the cart clears the photo gate. 6. In the analysis section your lab report, discuss the pros and cons of choosing a wide or a narrow ag, i.e., large or small to. 7. Set the photo gates to gate mode and sensitivity to 0.1 ms. Position the cart in front of gate 1 and record it as 1130. Release the cart from rest or give it a very gentle push. In pulse mode, the gates measure the time, An and Atg, it takes the cart to clear each of the individual photo gates. The gates do so by measuring the duration for which the ag on the cart interrupts the photo gate IR beam. 8. Try it out a few times, to get a feel for the process and see if the At, measurements make sense. 9. Record 6, w, m, 2:0, 2:1, 2:2 in Table 1. 10. Now, do your rst real run. Make sure to carefully record the position 2:0 from which you released the cart, as you will have to start from the some :50 for all subsequent runs. Record Ail and Atg in Table 2. 11. Repeat the process for at least N = 5 runs, releasing the cart each time from the same position, 1139. Table 1: Parameters m 'w 6' 3:0 2:1 2:2 Ll_l_l_l_lm Table 2: Data for Part 1 Observation no. Ah At; v1; v2; 1 N 5. 1 Calculations 1. Utilize w and At,- to compute the average velocity of the cart as it clears gate 1'. This gives an estimate of the required instantaneous velocity vim. Record the values in Table 2. 2. From the data of the N runs, compute an average value for \"U13 and 1:29;. Utilize Equation 2 to derive the experimental value of aI and then, an experimental value of g from Equation 1. Record your results in Table 3. 5.2 5.3 Effect of m and t9 . Place a mass of about 250 g on top of the cart and repeat the experiment and calcu- lations. . Change 6 to the other value out of: a: 2 or m 5 degrees and repeat the experiment and calculations. Error analysis and discussion . What is the trade-o in choosing the size a; of the ag? . Discuss possible sources of error that contribute to the error in the experimental value of g? . Do the values of am. and g depend upon m? . Do the value of a3 and g depend upon 6? Table 3: Results for Part 1 '01va that\7. Now, do your rst real run. Record the 3:1, 2:2 and At in Table 4. 8. Repeat the process, changing 2:2, so that the gates are separated by {20 cm, 40 cm,60 cm,80 cm, 100 cm}, a total of at least N = 5 runs. . 6.1 Calculations 1. Since, 01$ 2 0 (cart released from rest) and At = (t2 t1), Equation 3. simplies to 1 1132 = :31 + EaEAtz. (4) 2. You need to utilize Equation 4 to obtain a.I from a plot of your data. For accurate results and for convenience, let's convert Equation 4 in to a linear equation by taking the natural log on both sides. Thus, we get lI1(332 3:1) =ln(%a1) + 2 ln At. (5) 3. Now plot 111(132 331) versus ln At. Draw a best t straight line through your data points, and then obtain 0.3 from the intercept, and then, an experimental value of g from Equation 1. Record your results in Table 5 4. Change 9 to the other value out of: a 2 or m 5 degrees., and repeat the experiment and calculations. Table 4: Data for Part 2 Observation no. 121 122 At 1 N Table 5: Results for Part 2 am y TIL/32 % error = i? X 100 6.2 Error analysis and discussion 1. Discuss possible sources of error that contribute to the error in the experimental value of g? 2. Compare the results of Part 2 with those of Part 1. Which are more reliable? 7 Conclusion Briefly summarize your findings
Step by Step Solution
There are 3 Steps involved in it

Get step-by-step solutions from verified subject matter experts