

Question: Upload your Matlab Scripts and add commment each section Problem 9.7 - Statistics In science and engineering It is common to work with a collection
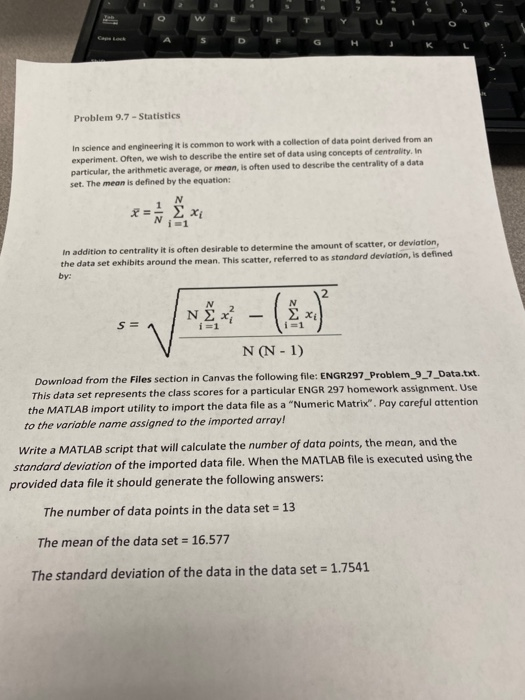
Problem 9.7 - Statistics In science and engineering It is common to work with a collection of data point derived from an experiment. Often, we wish to describe the entire set of data using concepts of centrality. In particular, the arithmetic average, or mean, is often used to describe the centrality of a data set. The mean is defined by the equation: - 2 x In addition to centrality it is often desirable to determine the amount of scatter, or deviation, the data set exhibits around the mean. This scatter, referred to as standard deviation, is defined by: N(N-1) Download from the Files section in Canvas the following file: ENGR297_Problem_9_7_Data.txt. This data set represents the class scores for a particular ENGR 297 homework assignment. Use the MATLAB import utility to import the data file as a "Numeric Matrix". Pay careful attention to the variable name assigned to the imported array! Write a MATLAB script that will calculate the number of data points, the mean, and the standard deviation of the imported data file. When the MATLAB file is executed using the provided data file it should generate the following answers: The number of data points in the data set = 13 The mean of the data set = 16.577 The standard deviation of the data in the data set = 1.7541
Step by Step Solution
There are 3 Steps involved in it

Get step-by-step solutions from verified subject matter experts