

Question: Upper Control Limit: Lower Control Limit: Based on the x-chart, the wire cutting process has been in control / out of control. The control limits
Upper Control Limit:
Lower Control Limit:
Based on the x-chart, the wire cutting process has been in control / out of control.
The control limits for the 3-sigma R-chart are:
Upper Control Limit:
Lower Control Limit:
Based on the R-chart, the wire cutting process has been: in control / out of control
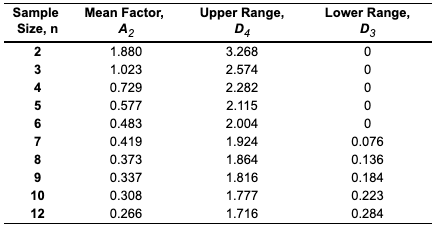
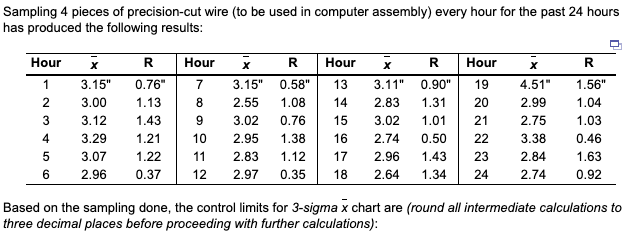
Sample Size, n Lower Range, D3 2 3 4 M G G Mean Factor, A2 1.880 1.023 0.729 0.577 0.483 0.419 0.373 0.337 0.308 0.266 Upper Range, D4 3.268 2.574 2.282 2.115 2.004 1.924 1.864 1.816 1.777 1.716 0 0 0 0 0.076 0.136 0.184 0.223 0.284 8 10 12 Sampling 4 pieces of precision-cut wire (to be used in computer assembly) every hour for the past 24 hours has produced the following results: Hour R R Hour 7 Hour 1 2 3 4 5 6 x 3.15" 3.00 3.12 3.29 3.07 2.96 R 0.76" 1.13 1.43 1.21 1.22 0.37 8 9 10 11 12 x 3.15" 2.55 3.02 2.95 2.83 2.97 R 0.58" 1.08 0.76 1.38 1.12 0.35 13 14 15 16 17 18 x 3.11" 2.83 3.02 2.74 2.96 2.64 0.90" 1.31 1.01 0.50 1.43 1.34 Hour 19 20 21 22 23 24 x 4.51" 2.99 2.75 3.38 2.84 2.74 1.56" 1.04 1.03 0.46 1.63 0.92 Based on the sampling done, the control limits for 3-sigma x chart are (round all intermediate calculations to three decimal places before proceeding with further calculations)Step by Step Solution
There are 3 Steps involved in it
1 Expert Approved Answer
Step: 1 Unlock

Question Has Been Solved by an Expert!
Get step-by-step solutions from verified subject matter experts
Step: 2 Unlock
Step: 3 Unlock