

Question: urday Final Kellen Mathias fer to Table S 6 . 1 - Factors for Computing Control Chart Limits ( 3 sigma ) for this problem.
urday Final
Kellen Mathias
fer to Table SFactors for Computing Control Chart Limits sigma for this problem.
ss Hopkins is attempting to monitor a filling process that has an overall average of The average range is
or a sample size of the control limits for sigma chart are:
Upper Control Limit round your response to three decimal places
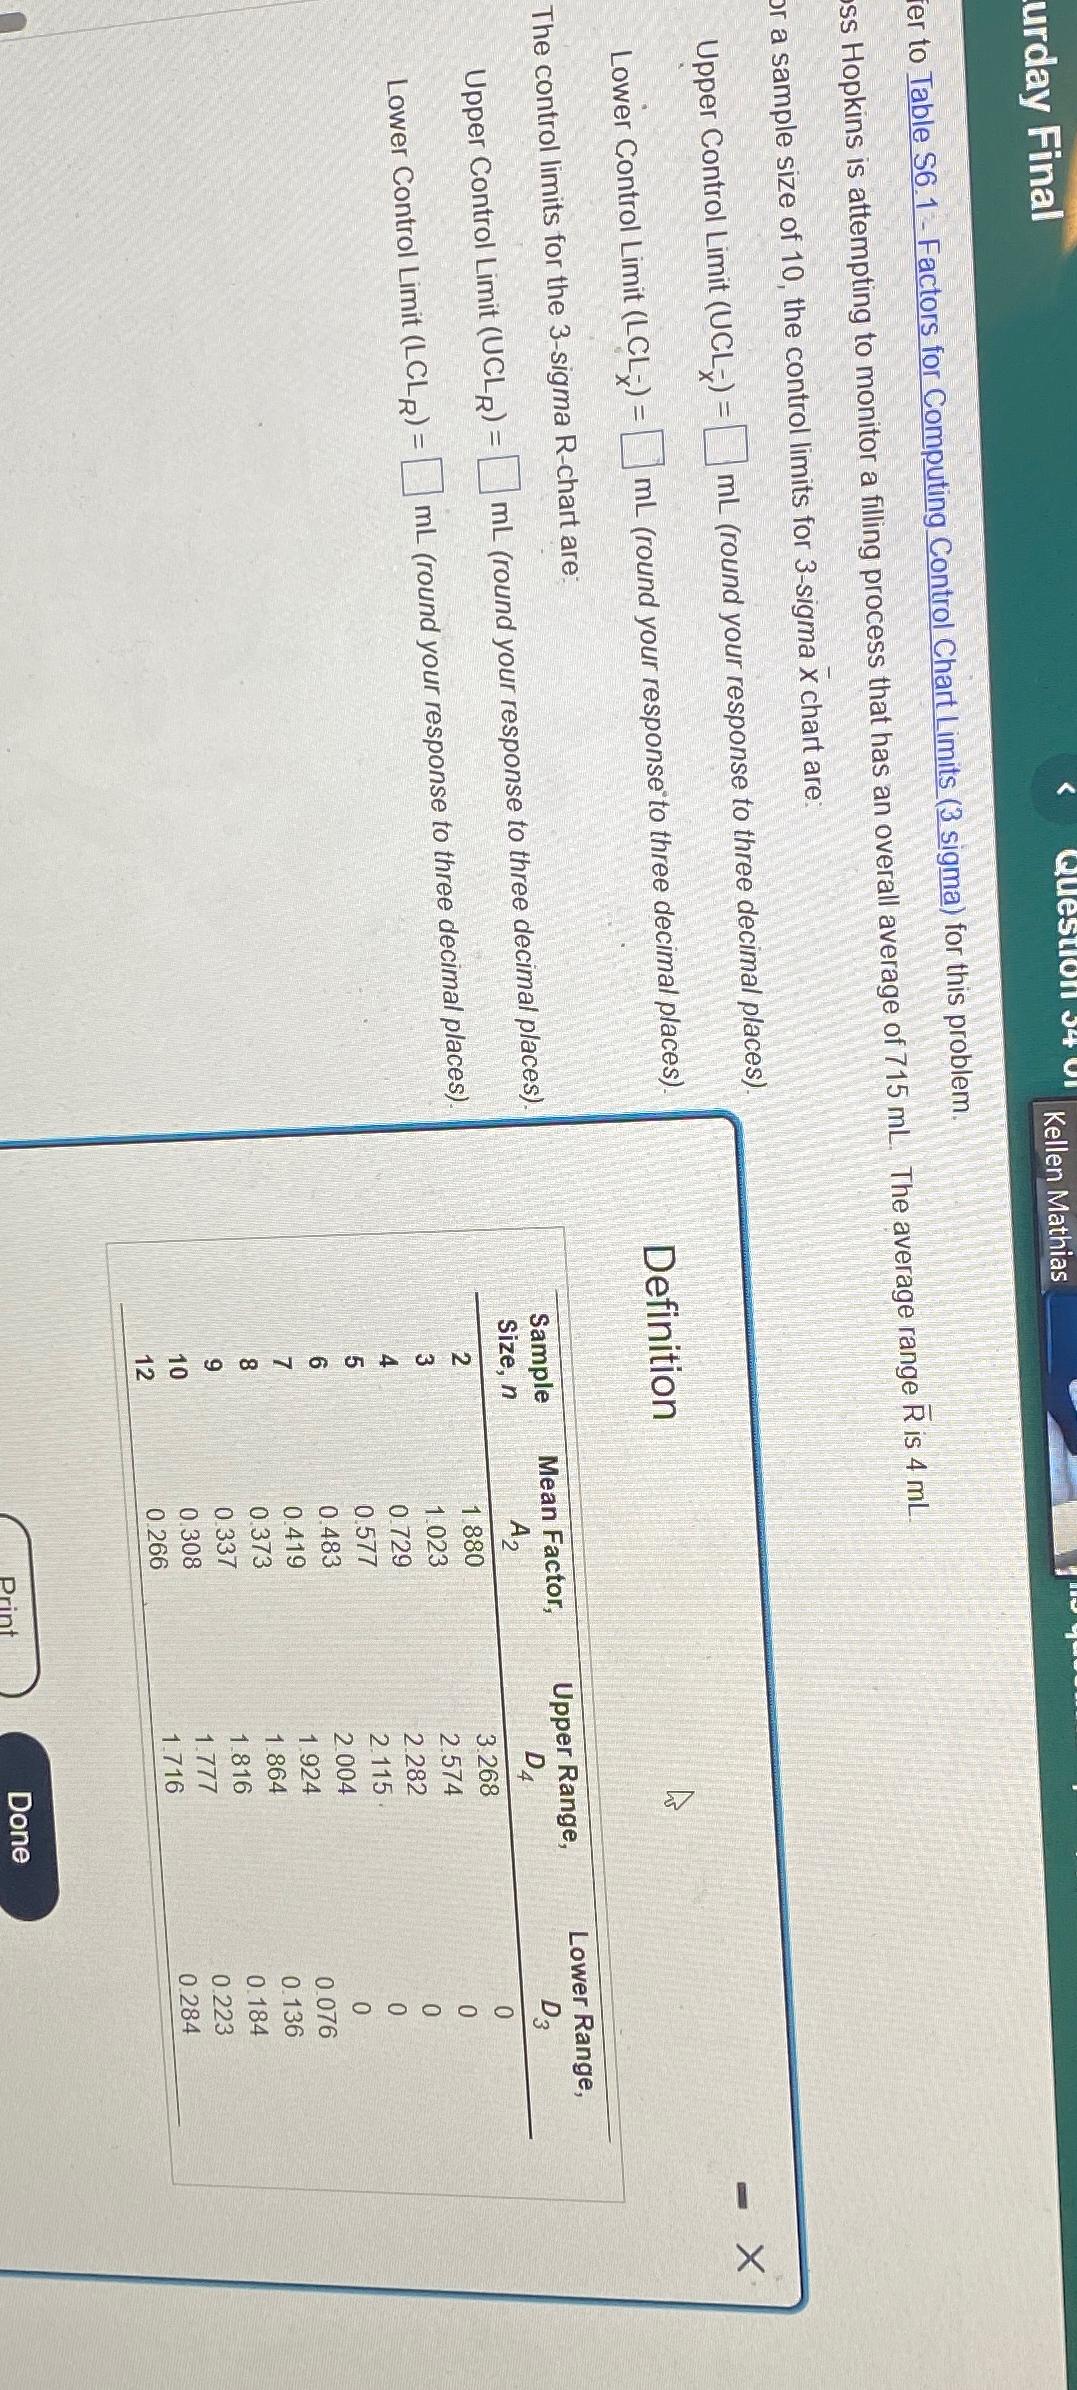
Definition
The control limits for the sigma Rchart are:
Upper Control Limit round your response to three decimal places
Lower Control Limit round your response to three decimal places
tabletableSampleSize
Step by Step Solution
There are 3 Steps involved in it
1 Expert Approved Answer
Step: 1 Unlock

Question Has Been Solved by an Expert!
Get step-by-step solutions from verified subject matter experts
Step: 2 Unlock
Step: 3 Unlock