

Question: Urgent help please. for the graph you can use Excel of draw in the paper. 2. A restaurant wants to analyze how long customers spend
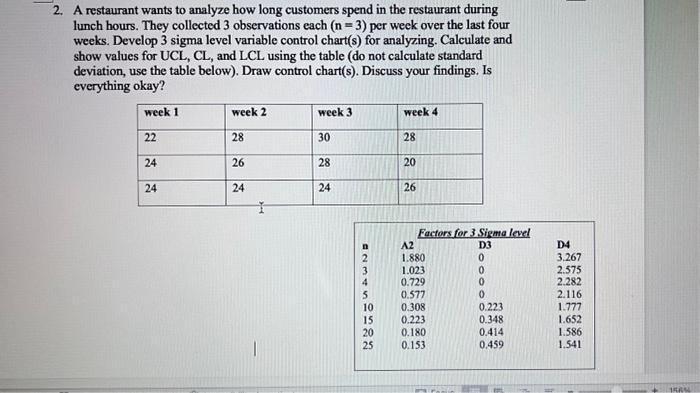
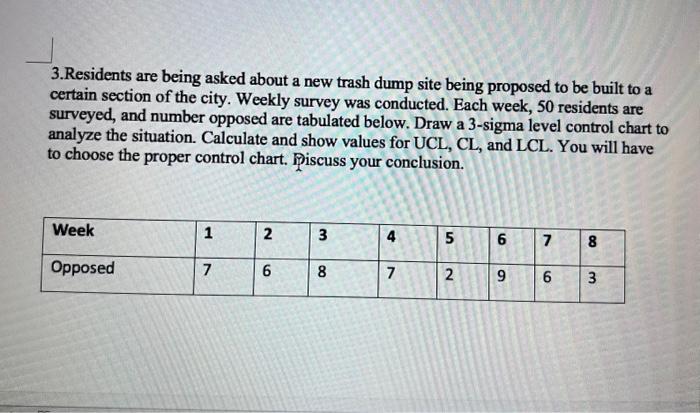
2. A restaurant wants to analyze how long customers spend in the restaurant during lunch hours. They collected 3 observations each (n=3) per week over the last four weeks. Develop 3 sigma level variable control chart(s) for analyzing. Calculate and show values for UCL, CL, and LCL using the table (do not calculate standard deviation, use the table below). Draw control chart(s). Discuss your findings. Is everything okay? 3.Residents are being asked about a new trash dump site being proposed to be built to a certain section of the city. Weekly survey was conducted. Each week, 50 residents are surveyed, and number opposed are tabulated below. Draw a 3-sigma level control chart to analyze the situation. Calculate and show values for UCL, CL, and LCL. You will have to choose the proper control chart. Piscuss your conclusion. 2. A restaurant wants to analyze how long customers spend in the restaurant during lunch hours. They collected 3 observations each (n=3) per week over the last four weeks. Develop 3 sigma level variable control chart(s) for analyzing. Calculate and show values for UCL, CL, and LCL using the table (do not calculate standard deviation, use the table below). Draw control chart(s). Discuss your findings. Is everything okay? 3.Residents are being asked about a new trash dump site being proposed to be built to a certain section of the city. Weekly survey was conducted. Each week, 50 residents are surveyed, and number opposed are tabulated below. Draw a 3-sigma level control chart to analyze the situation. Calculate and show values for UCL, CL, and LCL. You will have to choose the proper control chart. Piscuss your conclusion
Step by Step Solution
There are 3 Steps involved in it

Get step-by-step solutions from verified subject matter experts