

Question
(a) Plot the data on airplane shipments. Plot A Plot B Plot C Plot D US Aviation Quarterly Shipments (2009-2015) US Aviation Quarterly Shipments
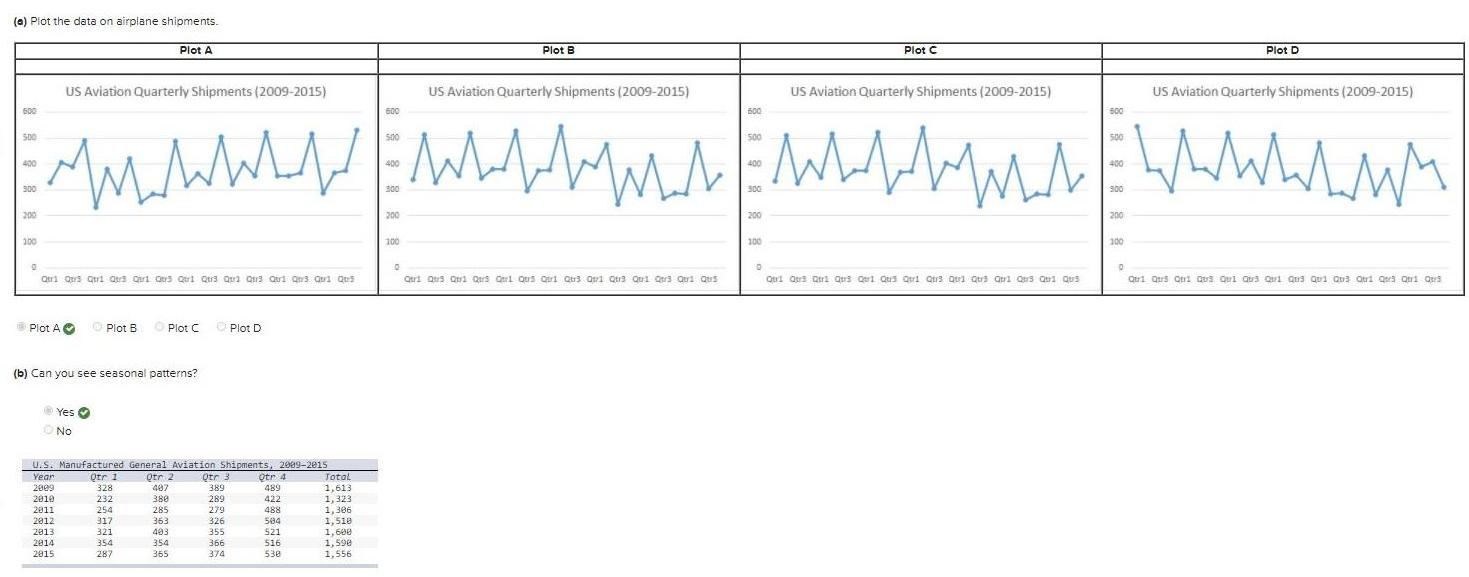
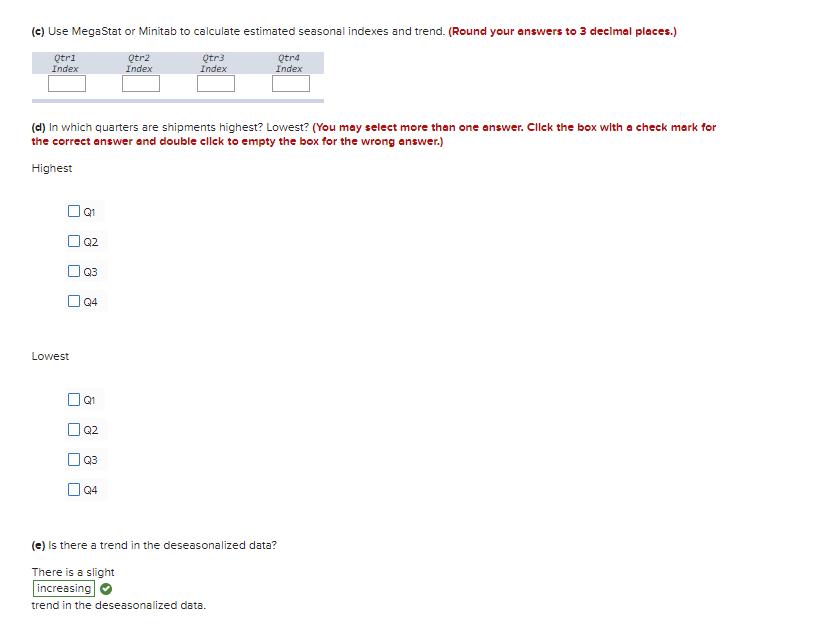
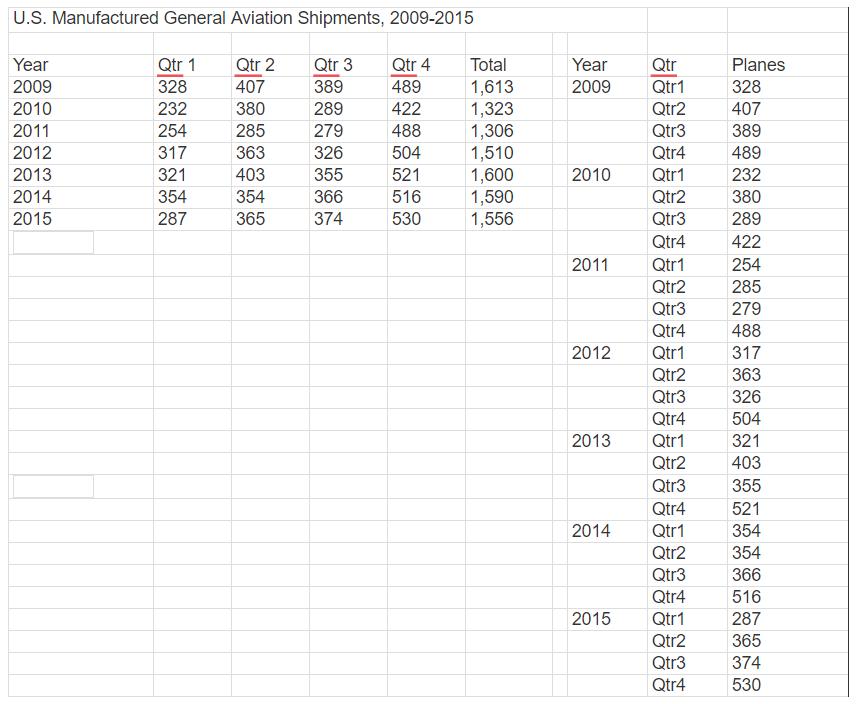
(a) Plot the data on airplane shipments. Plot A Plot B Plot C Plot D US Aviation Quarterly Shipments (2009-2015) US Aviation Quarterly Shipments (2009-2015) US Aviation Quarterly Shipments (2009-2015) US Aviation Quarterly Shipments (2009-2015) 600 500 500 500 500 400 400 400 300 300 300 200 200 200 200 100 100 100 Qtri Qs Qui Qus Qiri Ors Qui Qu3 Qui Qu3 Qui Qn3 Qui Qus Qri Qis Qui Qers Cerl Qus oari Qu3 O1 Qr3 Qui Qera Qui Qus Qtri Qra Dri Qus Qei Qus Qri Qu3 Qui Qus Ori Qars Qui Qus Qri Qus Qtrl Qua Qui Qus Qi Qua Qui Qu3 Qtri Qea Qri Qus Plot AO O Plot B O Plot C O Plot D (b) Can you see seasonal patterns? Yes O O No U.S. Manufactured General Aviation Shipments, 2009-2e15 Total 1,613 1, 323 1,306 1,510 1,600 1,590 1,556 Otr 2 Year 2009 2010 2011 2012 2013 2014 2015 Qrr 1 Otr 4 489 389 289 279 328 407 232 422 254 317 321 285 488 363 326 504 403 354 355 521 354 366 516 287 355 374 530 (c) Use MegaStat or Minitab to calculate estimated seasonal indexes and trend. (Round your answers to 3 decimal places.) Qtrl Index Qtr2 Index Qtr3 Index Qtr4 Index (d) in which quarters are shipments highest? Lowest? (You may select more than one answer. Click the box with a check mark for the correct answer and double cllck to empty the box for the wrong answer.) Highest O 92 Q3 O 94 Lowest O Q1 O Q2 O 93 O 94 (e) Is there a trend in the deseasonalized data? There is a slight increasing O trend in the deseasonalized data. U.S. Manufactured General Aviation Shipments, 2009-2015 Year Qtr 1 Qtr 2 Qtr 3 Qtr 4 Total Year Qtr Planes 2009 328 407 389 489 2009 Qtr1 328 1,613 1,323 1,306 1,510 2010 232 380 289 422 Qtr2 407 2011 254 285 279 488 Qtr3 389 2012 317 363 326 504 Qtr4 489 2013 321 403 355 521 2010 Qtr1 1,600 1,590 1,556 232 2014 354 354 366 516 Qtr2 380 2015 287 365 374 530 Qtr3 289 Qtr4 422 2011 Qtr1 254 Qtr2 285 Qtr3 279 Qtr4 488 2012 Qtr1 317 Qtr2 363 Qtr3 326 Qtr4 504 2013 Qtr1 321 Qtr2 403 Qtr3 355 Qtr4 521 2014 Qtr1 354 Qtr2 354 Qtr3 366 Qtr4 516 2015 Qtr1 287 Qtr2 365 Qtr3 374 Qtr4 530
Step by Step Solution
3.31 Rating (124 Votes )
There are 3 Steps involved in it
Step: 1
a The plot is b Yes we see seasonal patterns c ...
Get Instant Access with AI-Powered Solutions
See step-by-step solutions with expert insights and AI powered tools for academic success
Step: 2

Step: 3
Ace Your Homework with AI
Get the answers you need in no time with our AI-driven, step-by-step assistance
Get Started
Applied Statistics In Business And Economics
Authors: David Doane, Lori Seward
4th Edition
73521485, 978-0073521480