

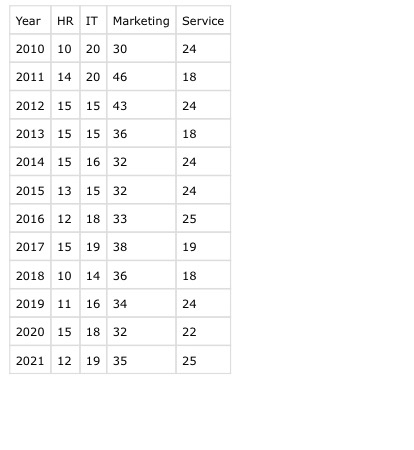
Question: Use a bar chart to compare the head counts between the departments in 2 0 1 2 . Use a line chart to show the
Use a bar chart to compare the head counts between the departments in
Use a line chart to show the change of the head count of all the departments across the years.
Use a pie chart to show the distribution of the head counts in
Add title and labels or legends for your charts. Add inline comments before each task
Step by Step Solution
There are 3 Steps involved in it
1 Expert Approved Answer
Step: 1 Unlock

Question Has Been Solved by an Expert!
Get step-by-step solutions from verified subject matter experts
Step: 2 Unlock
Step: 3 Unlock