

Question: Use a graphing calculator or technology to perform sinusoidal regression that will determine the sine function that best fits the data. Record the equation. Choose

- Use a graphing calculator or technology to perform sinusoidal regression that will determine the sine function that best fits the data. Record the equation.
- Choose a temperature (not a max or min temperature) and use the equation from part a) to find the months when the temperature is above your chosen temperature.
- Choose a month when the temperature is changing at a negative rate. Determine the instantaneous rate of change of temperature at that point.
SAMPLE:
- All sunrise and sunset data are taken from the first day of each month.
- All times have been converted to hours using decimal values: i.e. 5 hr 45 min = 5 + 45/60 = 5.75 hrs.
- Daylight hours are the difference between sunset time and sunrise time.
- Temperature is the average monthly temperature.
- DATA:
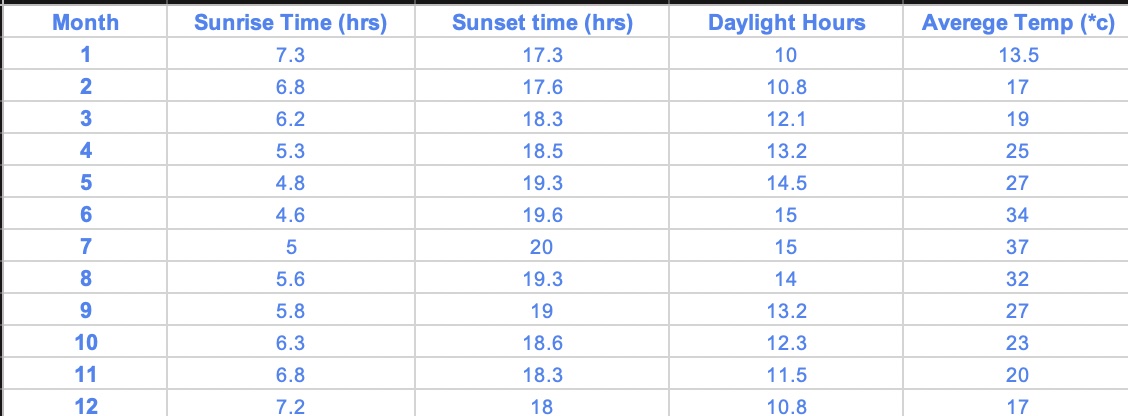
Month Sunrise Time (hrs) Sunset time (hrs) Daylight Hours Average Temp (*c) 7.3 17.3 10 13.5 2 6.8 17.6 10.8 17 3 6.2 18.3 12.1 19 LA 5.3 18.5 13.2 25 4.8 19.3 14.5 27 4.6 19.6 15 34 5 20 15 37 8 5.6 19.3 14 32 9 5.8 19 13.2 27 10 6.3 18.6 12.3 23 11 6.8 18.3 11.5 20 12 7.2 18 10.8 17
Step by Step Solution
There are 3 Steps involved in it
1 Expert Approved Answer
Step: 1 Unlock

Question Has Been Solved by an Expert!
Get step-by-step solutions from verified subject matter experts
Step: 2 Unlock
Step: 3 Unlock