

Question: Use a graphing calculator or technology to perform sinusoidal regression that will determine the sine function that best fits the data. Record the equation. Choose
- Use a graphing calculator or technology to perform sinusoidal regression that will determine the sine function that best fits the data. Record the equation.
- Choose a temperature (not a max or min temperature) and use the equation from part a) to find the months when the temperature is above your chosen temperature.
- Choose a month when the temperature is changing at a negative rate. Determine the instantaneous rate of change of temperature at that point.
SAMPLE:
- All sunrise and sunset data are taken from the first day of each month.
- All times have been converted to hours using decimal values: i.e. 5 hr 45 min = 5 + 45/60 = 5.75 hrs.
- Daylight hours are the difference between sunset time and sunrise time.
- Temperature is the average monthly temperature.
- DATA:
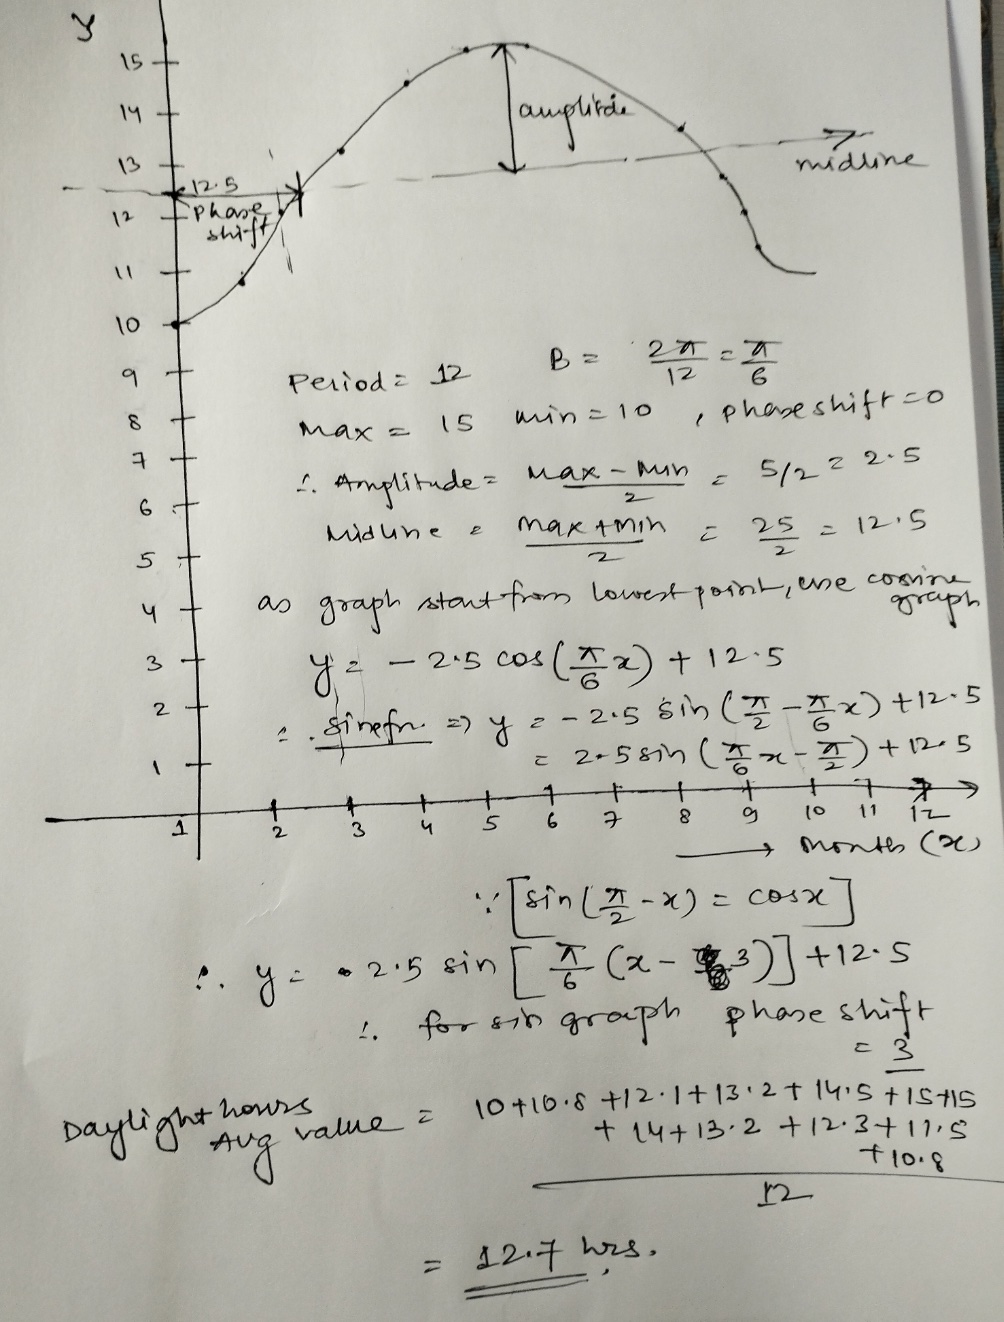
15 19 amplifi. 13 -12 . 5 midline 12 phase, shift 11 10 9 Period= 12 B = 21 = 12 8 6 Max = 15 win = 10 Iphoneshift so 7 6 ". Amplitude = Max - Min - 5/2 2 2. 5 5 Midline = martmin = 25 = 1215 as graph start from lowest point, we cosine graph 3 42 - 215 COS ( A x ) + 12.5 2 :. sinefn ?) 4 2 - 2.5 8in ( 7 - X x ) + 12. 5 = 2 + 5 8in ( II Ex - I ) + 12. 5 N - 3 u + 8 10 11 12 month (2) . : sin ( I - x ) = cosx ] .. y = $2 .5 sin [ ( x -$3)]+ 12.5 1. for sin graph phase shift Daylight hours Avg value 2 10 + 10 . 8 + 12 . 1+ 13 : 2 + 1415 + 15+15 + 14 + 13 . 2 + 12. 3+ 11,5 + 10. 8 12 = 12 7 was
Step by Step Solution
There are 3 Steps involved in it
1 Expert Approved Answer
Step: 1 Unlock

Question Has Been Solved by an Expert!
Get step-by-step solutions from verified subject matter experts
Step: 2 Unlock
Step: 3 Unlock