

Question: Use blocks in order to compare the linear and nonlinear results. Describe the results. Does the linear or nonlinear model best explain funding? Provide a
- Use blocks in order to compare the linear and nonlinear results.
- Describe the results. Does the linear or nonlinear model best explain funding? Provide a thorough analysis of the below listed results.
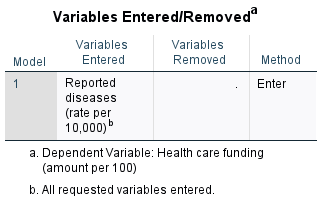
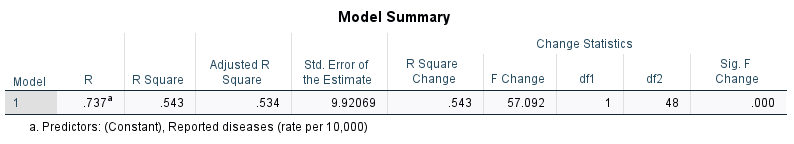
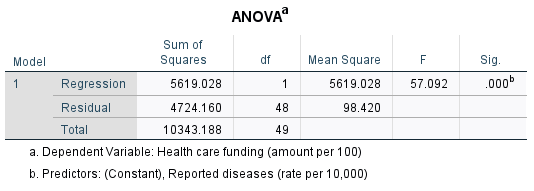
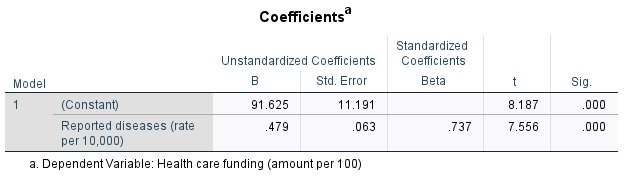
Variables Entered/Removed a Variables Variables Model Entered Removed Method Reported Enter diseases (rate per 10,000) a. Dependent Variable: Health care funding (amount per 100) b. All requested variables entered.Model Summary Change Statistics Adjusted R Std. Error of R Square Sig. F Model R R Square Square the Estimate Change F Change df1 df2 Change 1 737 543 534 9.92069 .543 57.092 48 000 a. Predictors: (Constant), Reported diseases (rate per 10,000)ANOVA" Sum of Model Squares df Mean Square F Sig Regression 5619.028 5619.028 57.092 000 Residual 4724.160 48 98.420 Total 10343.188 49 a. Dependent Variable: Health care funding (amount per 100) b. Predictors: (Constant), Reported diseases (rate per 10,000)Coefficients Standardized Unstandardized Coefficients Coefficients Model B Std. Error Beta Sig. (Constant) 91.625 11.191 8.187 000 Reported diseases (rate .479 063 737 7.556 .000 per 10,000) a. Dependent Variable: Health care funding (amount per 100)
Step by Step Solution
There are 3 Steps involved in it

Get step-by-step solutions from verified subject matter experts