

Question: Use data for Stocks A, B & C below to calculate: 1. Expected return and standard deviation of returns for each stock (so, three expected
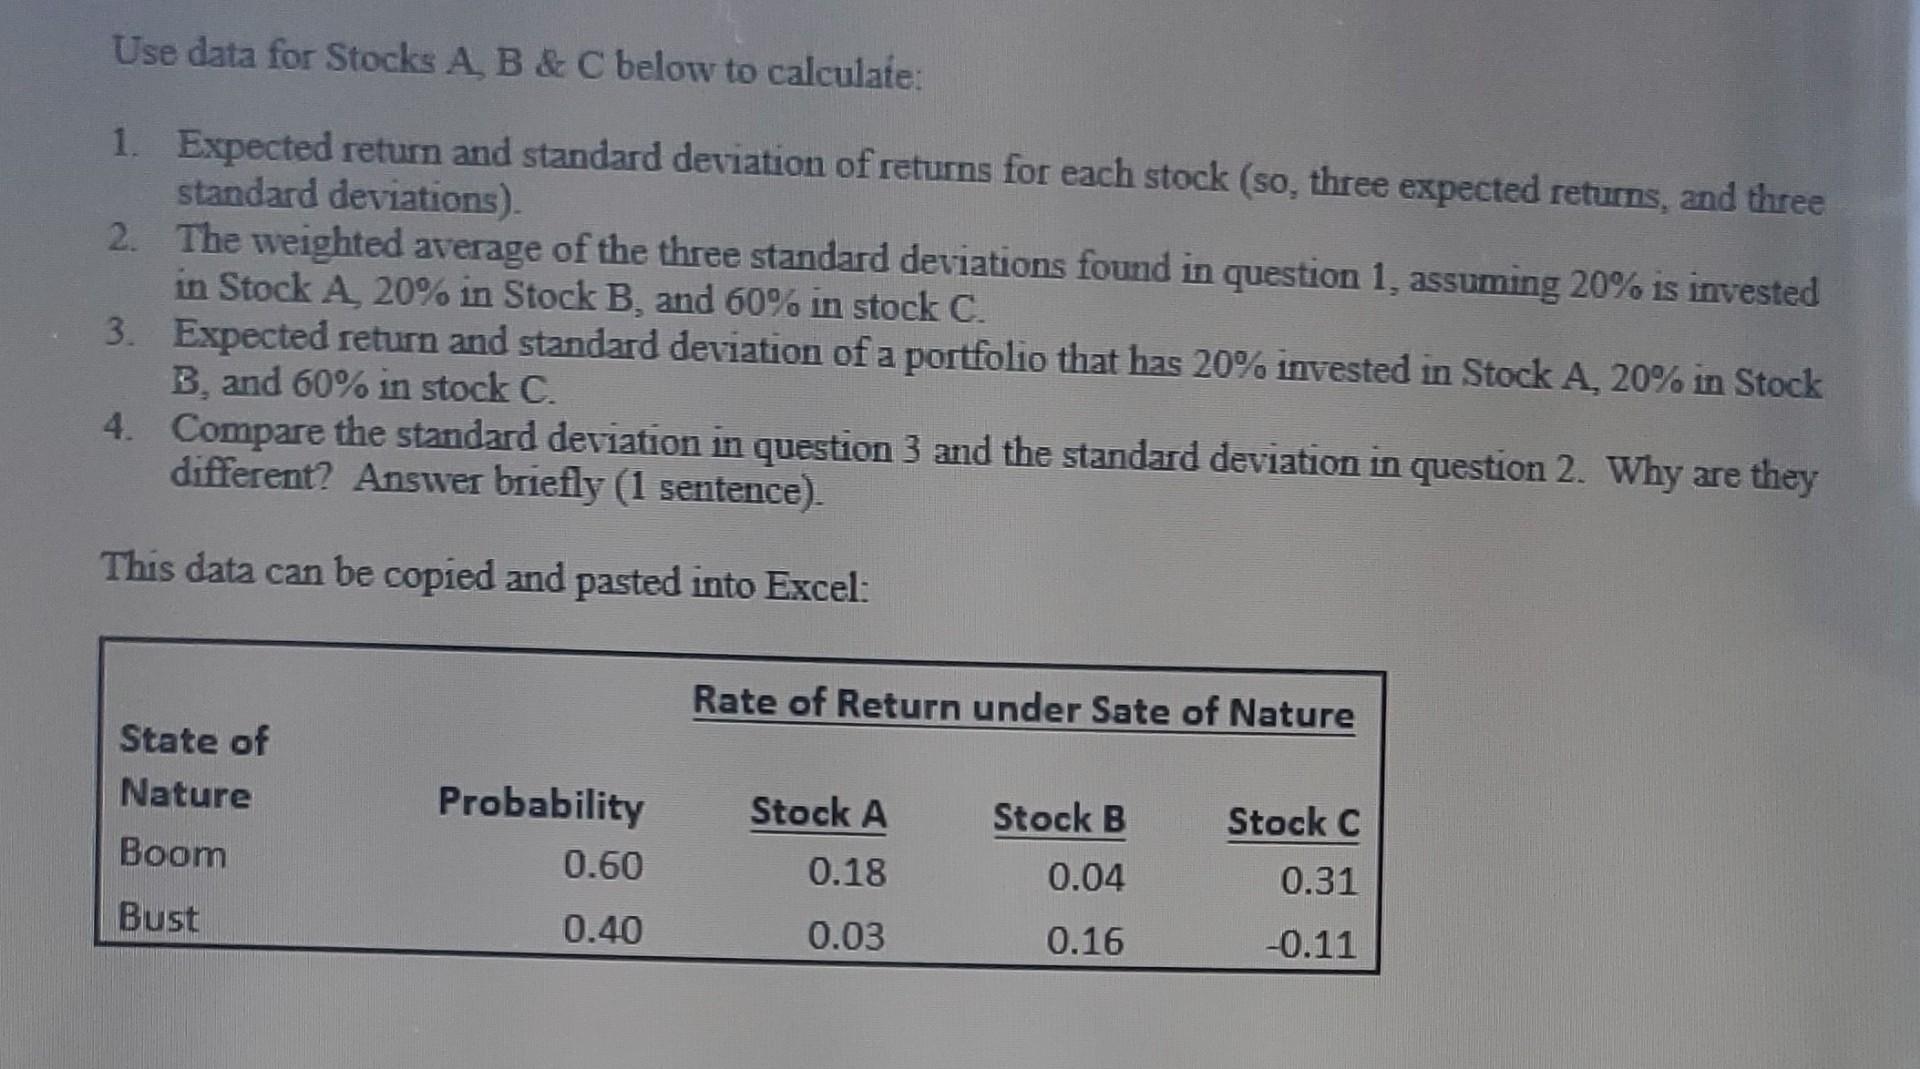
Use data for Stocks A, B \& C below to calculate: 1. Expected return and standard deviation of returns for each stock (so, three expected returns, and three standard deviations). 2. The weighted average of the three standard deviations found in question 1, assuming 20% is invested in Stock A, 20% in Stock B, and 60% in stock C. 3. Expected return and standard deviation of a portfolio that has 20% invested in Stock A, 20\% in Stock B, and 60% in stock C. 4. Compare the standard deviation in question 3 and the standard deviation in question 2. Why are they different? Answer briefly (1 sentence). This data can be copied and pasted into Excel
Step by Step Solution
There are 3 Steps involved in it

Get step-by-step solutions from verified subject matter experts