

Question: excel pls Use data for Stocks A, B & C below to calculate: 1. Expected return and standard deviation of returns for each stock (so,
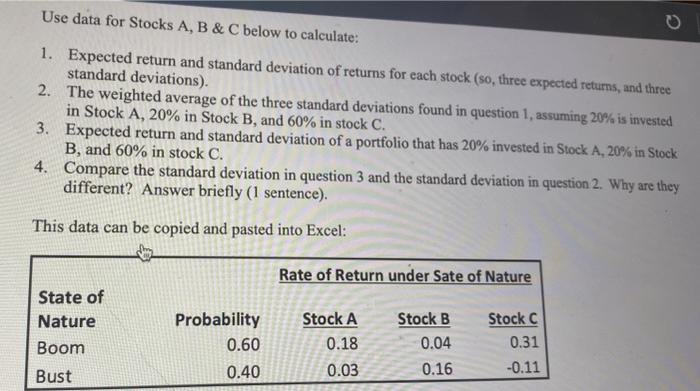
Use data for Stocks A, B \& C below to calculate: 1. Expected return and standard deviation of returns for each stock (so, three expected returns, and three standard deviations). 2. The weighted average of the three standard deviations found in question 1 , assuming 20% is invested in Stock A, 20\% in Stock B, and 60% in stock C. 3. Expected return and standard deviation of a portfolio that has 20% invested in Stock A, 20% in Stock B, and 60% in stock C. 4. Compare the standard deviation in question 3 and the standard deviation in question 2 . Why are they different? Answer briefly ( 1 sentence). This data can be copied and pasted into Excel
Step by Step Solution
There are 3 Steps involved in it

Get step-by-step solutions from verified subject matter experts