

Question: Use data provided to build a X Bar and R control chart: a.Calculate x x (x bar) and x x (x double bar) b.Calculate R
Use data provided to build a X Bar and R control chart:
a.Calculate x x (x bar) and x x (x double bar) b.Calculate R and R bar c.Compute Control limits and center line for X chart d.Compute Control limits and center line for R chart e.Construct X bar and R Control charts (scan or picture need to be sent to email15 minutes maximum after test submission)- Add all elements-Hand made, no excel. Plot the sub-groups. f.Comment about control charts and provide observations and recommendations.
Hints* Upper Control Limit (UCL) = X double bar + A2 * R bar. Lower Control Limit (LCL) = X double bar - A2 * R bar. Upper Control Limit (UCL) = D4 * R bar. Lower Control Limit (LCL) = D3 * R bar.
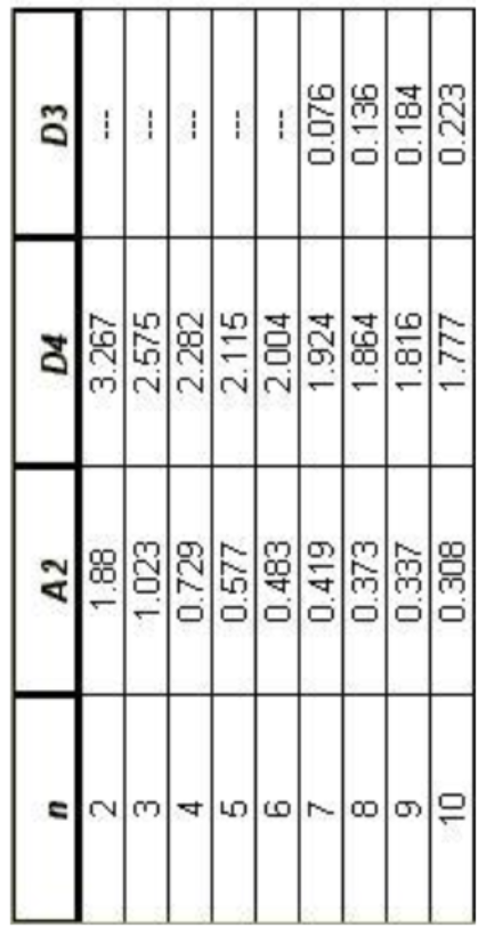
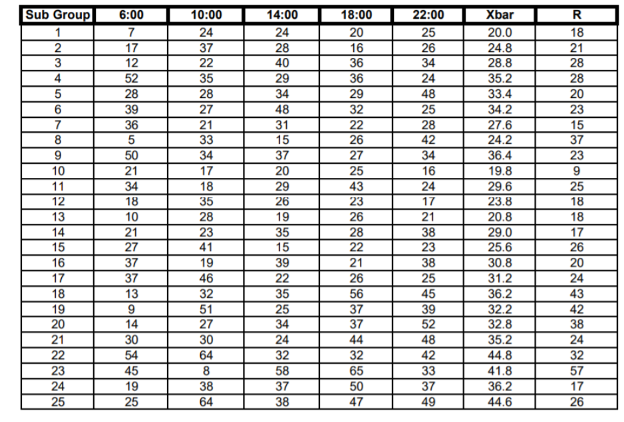
\begin{tabular}{|c|c|c|c|} \hline n & A2 & D4 & D3 \\ \hline 2 & 1.88 & 3.267 & \\ \hline 3 & 1.023 & 2.575 & \\ \hline 4 & 0.729 & 2.282 & \\ \hline 5 & 0.577 & 2.115 & \\ \hline 6 & 0.483 & 2.004 & \\ \hline 7 & 0.419 & 1.924 & 0.076 \\ \hline 8 & 0.373 & 1.864 & 0.136 \\ \hline 9 & 0.337 & 1.816 & 0.184 \\ \hline 10 & 0.308 & 1.777 & 0.223 \\ \hline \end{tabular} \begin{tabular}{|c|c|c|c|c|c|c|c|} \hline Sub Group & 6:00 & 10:00 & 14:00 & 18:00 & 22:00 & Xbar & R \\ \hline 1 & 7 & 24 & 24 & 20 & 25 & 20.0 & 18 \\ \hline 2 & 17 & 37 & 28 & 16 & 26 & 24.8 & 21 \\ \hline 3 & 12 & 22 & 40 & 36 & 34 & 28.8 & 28 \\ \hline 4 & 52 & 35 & 29 & 36 & 24 & 35.2 & 28 \\ \hline 5 & 28 & 28 & 34 & 29 & 48 & 33.4 & 20 \\ \hline 6 & 39 & 27 & 48 & 32 & 25 & 34.2 & 23 \\ \hline 7 & 36 & 21 & 31 & 22 & 28 & 27.6 & 15 \\ \hline 8 & 5 & 33 & 15 & 26 & 42 & 24.2 & 37 \\ \hline 9 & 50 & 34 & 37 & 27 & 34 & 36.4 & 23 \\ \hline 10 & 21 & 17 & 20 & 25 & 16 & 19.8 & 9 \\ \hline 11 & 34 & 18 & 29 & 43 & 24 & 29.6 & 25 \\ \hline 12 & 18 & 35 & 26 & 23 & 17 & 23.8 & 18 \\ \hline 13 & 10 & 28 & 19 & 26 & 21 & 20.8 & 18 \\ \hline 14 & 21 & 23 & 35 & 28 & 38 & 29.0 & 17 \\ \hline 15 & 27 & 41 & 15 & 22 & 23 & 25.6 & 26 \\ \hline 16 & 37 & 19 & 39 & 21 & 38 & 30.8 & 20 \\ \hline 17 & 37 & 46 & 22 & 26 & 25 & 31.2 & 24 \\ \hline 18 & 13 & 32 & 35 & 56 & 45 & 36.2 & 43 \\ \hline 19 & 9 & 51 & 25 & 37 & 39 & 32.2 & 42 \\ \hline 20 & 14 & 27 & 34 & 37 & 52 & 32.8 & 38 \\ \hline 21 & 30 & 30 & 24 & 44 & 48 & 35.2 & 24 \\ \hline 22 & 54 & 64 & 32 & 32 & 42 & 44.8 & 32 \\ \hline 23 & 45 & 8 & 58 & 65 & 33 & 41.8 & 57 \\ \hline 24 & 19 & 38 & 37 & 50 & 37 & 36.2 & 17 \\ \hline 25 & 25 & 64 & 38 & 47 & 49 & 44.6 & 26 \\ \hline \end{tabular}
Step by Step Solution
There are 3 Steps involved in it

Get step-by-step solutions from verified subject matter experts