

Question: show calculation for UCL and LCL A quality inspector took five samples, each with four observations (n = 4), of the length of time for
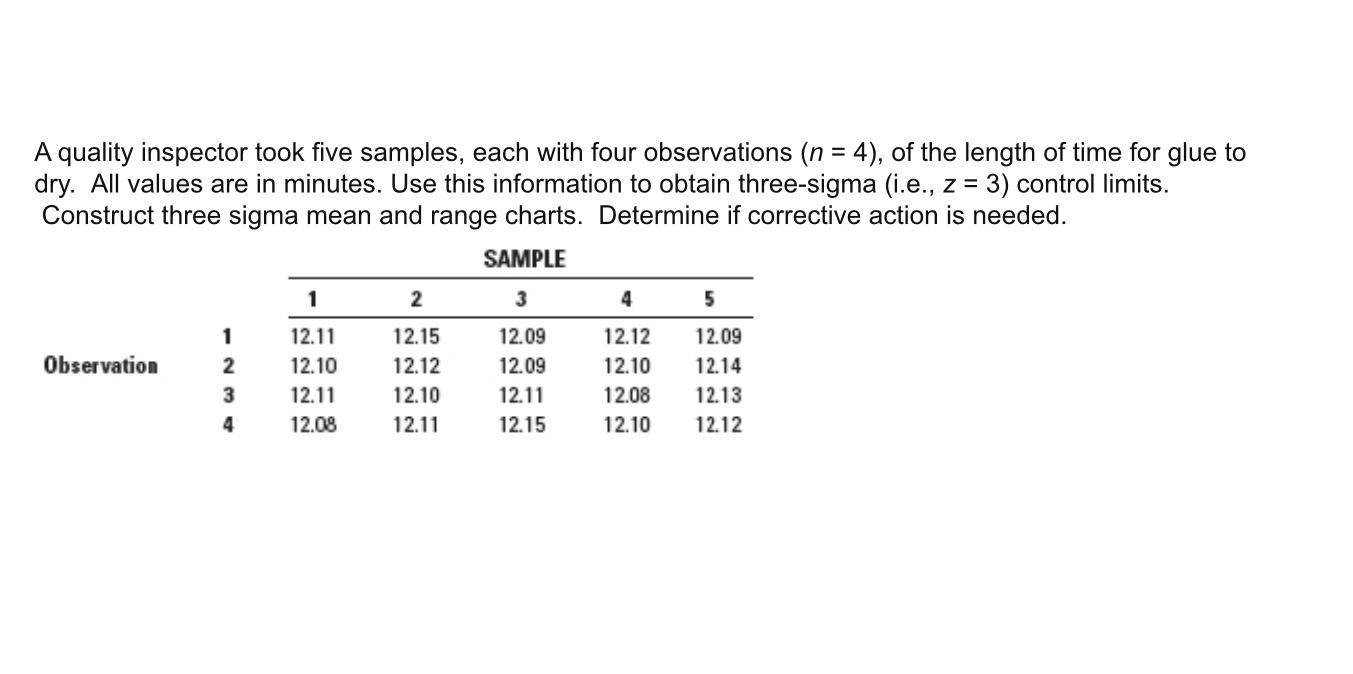
 show calculation for UCL and LCL
Step by Step Solution
There are 3 Steps involved in it
1 Expert Approved Answer
Step: 1 Unlock

Question Has Been Solved by an Expert!
Get step-by-step solutions from verified subject matter experts
Step: 2 Unlock
Step: 3 Unlock