

Question: use Excel format for the table wrong Answer down'vote cDdcdB AaBbCcDc AaBbCcDDE Normal No Spacing Heading 1 Heading 2 Use the information presented in Case
use Excel format for the table wrong Answer down'vote
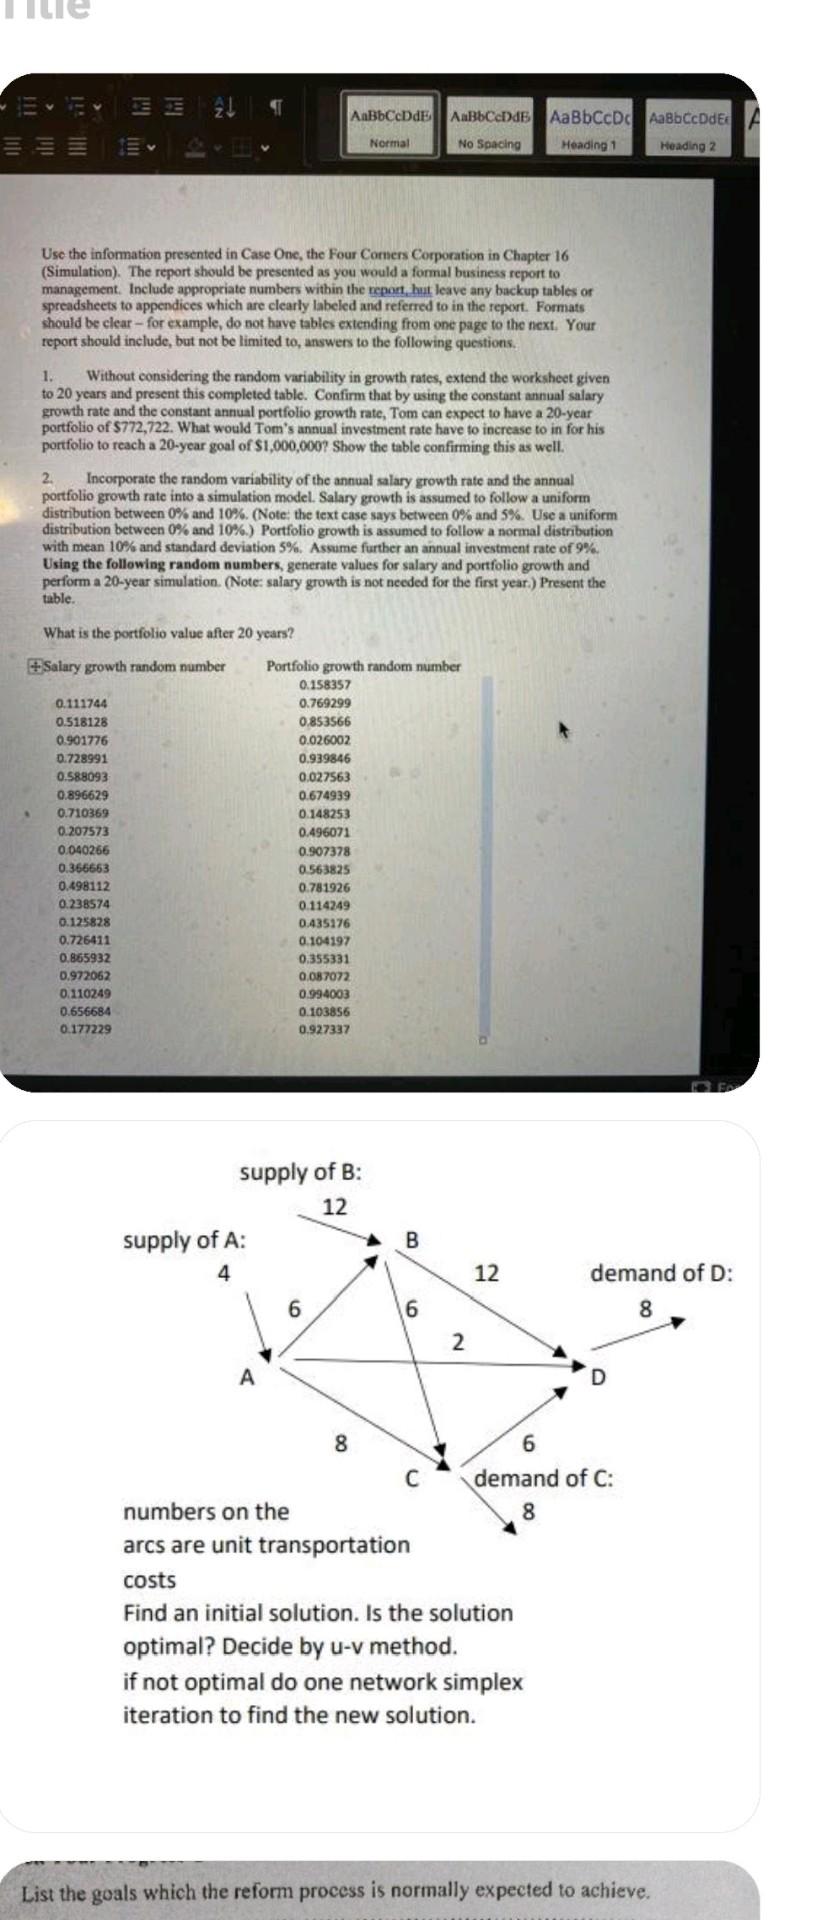
cDdcdB AaBbCcDc AaBbCcDDE Normal No Spacing Heading 1 Heading 2 Use the information presented in Case One, the Four Comers Corporation in Chapter 16 (Simulation). The report should be presented as you would a formal business report to management. Include appropriate numbers within the repon, but leave any backup tables or spreadsheets to appendices which are clearly labeled and referred to in the report. Formats should be clear - for example, do not have tables extending from one page to the next. Your report should include, but not be limited to, answers to the following questions. 1. Without considering the random variability in growth rates, extend the worksheet given to 20 years and present this completed table. Confirm that by using the constant annual salary growth rate and the constant annual portfolio growth rate, Tom can expect to have a 20-year portfolio of $772,722. What would Tom's annual investment rate have to increase to in for his portfolio to reach a 20-year goal of $1,000,000? Show the table confirming this as well. 2. Incorporate the random variability of the annual salary growth rate and the annual portfolio growth rate into a simulation model. Salary growth is assumed to follow a uniform distribution between 0% and 10%. (Note: the text case says between 0% and 5%. Use a uniform distribution between 0% and 10%.) Portfolio growth is assumed to follow a normal distribution with mean 10% and standard deviation 5%. Assume further an annual investment rate of 9% Using the following random numbers, generate values for salary and portfolio growth and perform a 20-year simulation. (Note: salary growth is not needed for the first year.) Present the table. What is the portfolio value after 20 years? Salary growth random number Portfolio growth random number 0.158357 0.111744 0.769299 0.518128 0.853566 0.901776 0.026002 0.728991 0.939846 0.588093 0.027563 0.896629 0.674939 0.710369 0.148253 0.207573 0.496071 0.040266 0.907378 0.366663 0.563825 0.498112 0.781926 0.238574 0.114249 0.125828 0.435176 0.726411 0.104197 0.865932 0.355331 0.972062 0.087072 0.110249 0.994003 0.656684 0.103856 0.177229 0.927337 supply of B: 12 supply of A: 4 B 12 demand of D: 8 6 6 2 oo 6 demand of c: numbers on the 8 arcs are unit transportation costs Find an initial solution. Is the solution optimal? Decide by u-v method. if not optimal do one network simplex iteration to find the new solution. List the goals which the reform process is normally expected to achieveStep by Step Solution
There are 3 Steps involved in it
1 Expert Approved Answer
Step: 1 Unlock

Question Has Been Solved by an Expert!
Get step-by-step solutions from verified subject matter experts
Step: 2 Unlock
Step: 3 Unlock