

Question: Q1. Industrial engineers periodically conduct work measurement analyses to determine the time used to produce a single unit of output. At a large processing
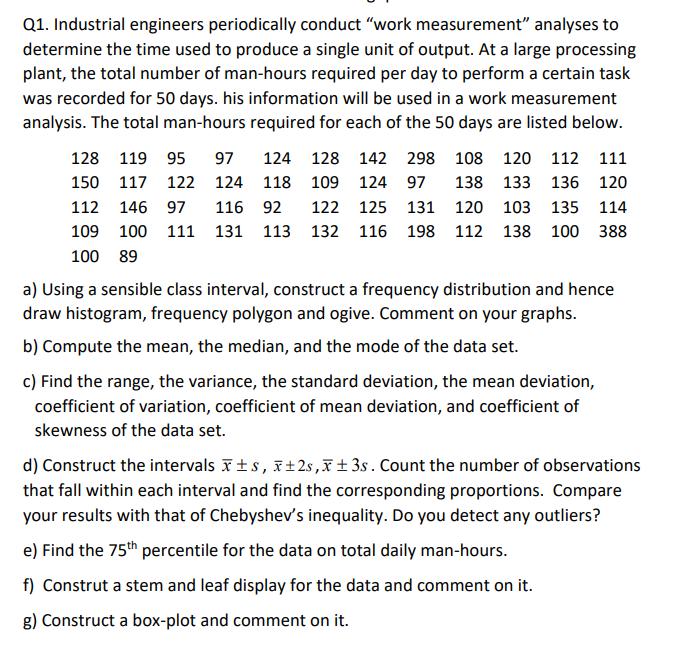
Q1. Industrial engineers periodically conduct "work measurement" analyses to determine the time used to produce a single unit of output. At a large processing plant, the total number of man-hours required per day to perform a certain task was recorded for 50 days. his information will be used in a work measurement analysis. The total man-hours required for each of the 50 days are listed below. 128 119 95 97 124 128 142 298 108 120 112 111 150 117 122 124 118 109 124 97 138 133 136 120 112 146 97 116 92 122 125 131 120 103 135 114 109 100 111 131 113 132 116 198 112 138 100 388 100 89 a) Using a sensible class interval, construct a frequency distribution and hence draw histogram, frequency polygon and ogive. Comment on your graphs. b) Compute the mean, the median, and the mode of the data set. c) Find the range, the variance, the standard deviation, the mean deviation, coefficient of variation, coefficient of mean deviation, and coefficient of skewness of the data set. d) Construct the intervals ts, I+2s,x+3s. Count the number of observations that fall within each interval and find the corresponding proportions. Compare your results with that of Chebyshev's inequality. Do you detect any outliers? e) Find the 75th percentile for the data on total daily man-hours. f) Construt a stem and leaf display for the data and comment on it. g) Construct a box-plot and comment on it.
Step by Step Solution
3.40 Rating (159 Votes )
There are 3 Steps involved in it
First to do any kind of calculations we have to enter the given data into a Worksheet In case of the given problem we insert the given data into the first column as follows the whole data cannot be sh... View full answer

Get step-by-step solutions from verified subject matter experts