

Question: Use Excel to perform a sieve analysis and plot the grain size distribution curve ( GSD ) of the soil. The format of the graph
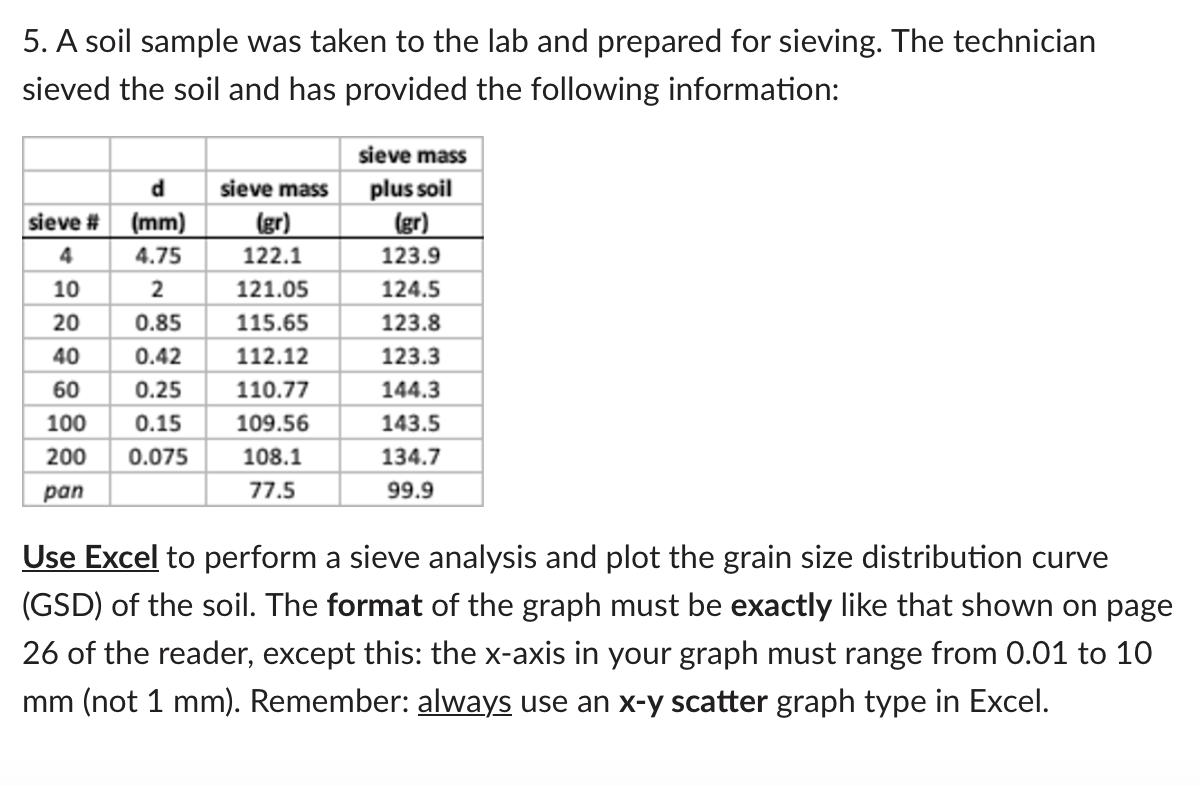
Use Excel to perform a sieve analysis and plot the grain size distribution curve
GSD of the soil. The format of the graph must be exactly like that shown on page
of the reader, except this: the xaxis in your graph must range from to
mm not mm Remember: always use an xy scatter graph type in Excel.
Step by Step Solution
There are 3 Steps involved in it
1 Expert Approved Answer
Step: 1 Unlock

Question Has Been Solved by an Expert!
Get step-by-step solutions from verified subject matter experts
Step: 2 Unlock
Step: 3 Unlock