

Question: use excel to Visualize the data in the table, using Conditional formatting You are team lead's in some company. Design the table so that you
use excel to Visualize the data in the table, using Conditional formatting You are team lead's in some company. Design the table so that you can see: 1) the largest revenue; 2) the best employee by revenue; 3) the best employee by revenue every day 4) the best day after revenue for each employee Copy the table for each solution.
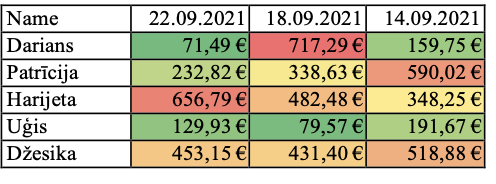
\begin{tabular}{|l|r|r|r|} \hline Name & 22.09 .2021 & 18.09 .2021 & 14.09 .2021 \\ \hline Darians & 71,49 & 717,29 & 159,75 \\ \hline Patrcija & 232,82 & 338,63 & 590,02 \\ \hline Harijeta & 656,79 & 482,48 & 348,25 \\ \hline Ugis & 129,93 & 79,57 & 191,67 \\ \hline Desika & 453,15 & 431,40 & 518,88 \\ \hline \end{tabular}
Step by Step Solution
There are 3 Steps involved in it

Get step-by-step solutions from verified subject matter experts