

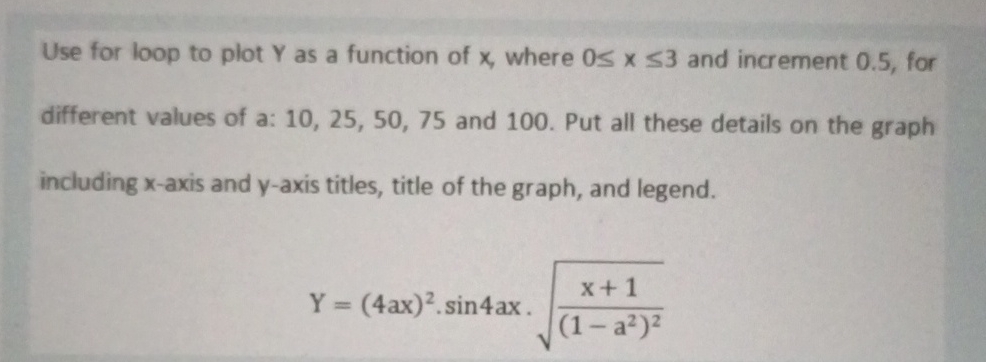
Question: Use for loop to plot Y as a function of x , where 0 x 3 and increment 0 . 5 , for different values
Use for loop to plot as a function of where and increment for different values of a: and Put all these details on the graph including axis and axis titles, title of the graph, and legend.
write a matlab script
Step by Step Solution
There are 3 Steps involved in it
1 Expert Approved Answer
Step: 1 Unlock

Question Has Been Solved by an Expert!
Get step-by-step solutions from verified subject matter experts
Step: 2 Unlock
Step: 3 Unlock