

Question: MATLAB ONLY PLEASE Use for loop to plot X as a function of time (t), where Osts 2 and increment 0.5, for different values of
MATLAB ONLY PLEASE
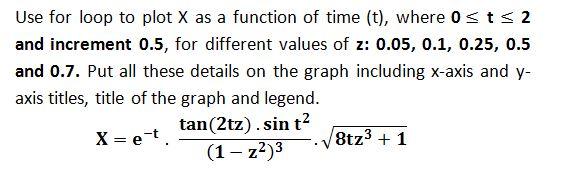
Use for loop to plot X as a function of time (t), where Osts 2 and increment 0.5, for different values of z: 0.05, 0.1, 0.25, 0.5 and 0.7. Put all these details on the graph including X-axis and y- axis titles, title of the graph and legend. tan(2tz). sin t? X = et 8tz3 + 1 (1 - 223
Step by Step Solution
There are 3 Steps involved in it
1 Expert Approved Answer
Step: 1 Unlock

Question Has Been Solved by an Expert!
Get step-by-step solutions from verified subject matter experts
Step: 2 Unlock
Step: 3 Unlock