

Question: Use function matlab Plot the surface generated by z = s i n { c o s 2 ( x 0 . 5 ) +
Use "function" matlab
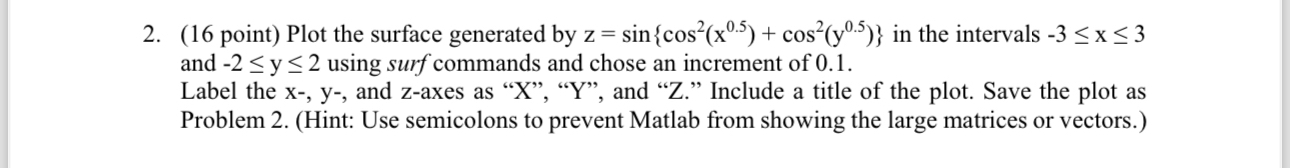
Plot the surface generated by in the intervals
and using surf commands and chose an increment of
Label the and axes as Y and Z Include a title of the plot. Save the plot as
Problem Hint: Use semicolons to prevent Matlab from showing the large matrices or vectors.
Step by Step Solution
There are 3 Steps involved in it
1 Expert Approved Answer
Step: 1 Unlock

Question Has Been Solved by an Expert!
Get step-by-step solutions from verified subject matter experts
Step: 2 Unlock
Step: 3 Unlock