

Question: Use matlab 4. You are to write a script that will create the colorful plot shown below. The equations for plot the t 1.6cos (24
Use matlab 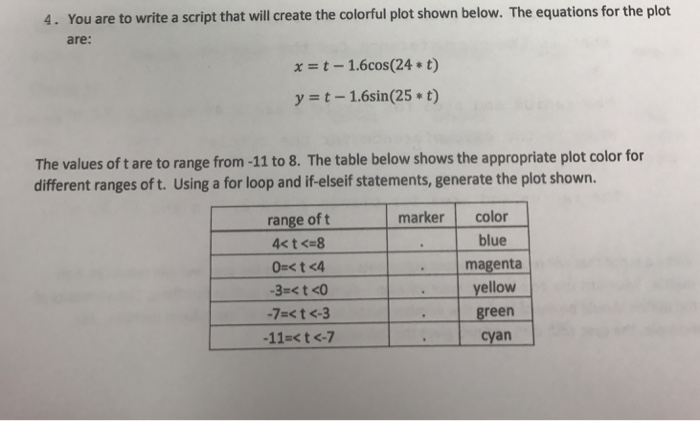
4. You are to write a script that will create the colorful plot shown below. The equations for plot the t 1.6cos (24 t) y t- 1.6 sin(25 t) The values of t are to range from -11 to 8. The table below shows the appropriate plot color for different ranges oft. Using a for loop and if elseif statements, generate the plot shown. marker color range of t blue magenta ellow green -11 t
Step by Step Solution
There are 3 Steps involved in it
1 Expert Approved Answer
Step: 1 Unlock

Question Has Been Solved by an Expert!
Get step-by-step solutions from verified subject matter experts
Step: 2 Unlock
Step: 3 Unlock