

Question: Use Matlab data1.txt: https://ufile.io1kdj 1. Using load(), plot(), subplot( ), hist() and possibly sort() or sortrows( or find(), (a)Load data from data1.txt (provided) into workspace.
Use Matlab
data1.txt: https://ufile.io1kdj
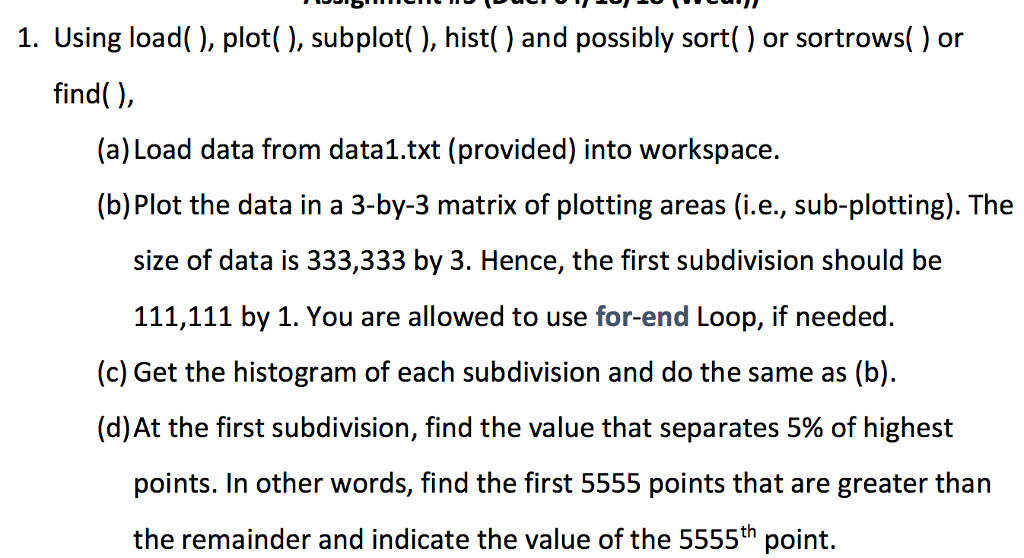
1. Using load(), plot(), subplot( ), hist() and possibly sort() or sortrows( or find(), (a)Load data from data1.txt (provided) into workspace. (b) Plot the data in a 3-by-3 matrix of plotting areas (i.e., sub-plotting). The size of data is 333,333 by 3. Hence, the first subdivision should be 111,111 by 1. You are allowed to use for-end Loop, if needed. (c) Get the histogram of each subdivision and do the same as (b) (d)At the first subdivision, find the value that separates 5% of highest points. In other words, find the first 5555 points that are greater than the remainder and indicate the value of the 5555th point. 1. Using load(), plot(), subplot( ), hist() and possibly sort() or sortrows( or find(), (a)Load data from data1.txt (provided) into workspace. (b) Plot the data in a 3-by-3 matrix of plotting areas (i.e., sub-plotting). The size of data is 333,333 by 3. Hence, the first subdivision should be 111,111 by 1. You are allowed to use for-end Loop, if needed. (c) Get the histogram of each subdivision and do the same as (b) (d)At the first subdivision, find the value that separates 5% of highest points. In other words, find the first 5555 points that are greater than the remainder and indicate the value of the 5555th point
Step by Step Solution
There are 3 Steps involved in it

Get step-by-step solutions from verified subject matter experts