

Question: Use Matlab to graphically compare the maximum shear stress and distortion energy failure criteria for cases of plane stress, and for AISI 1010 HR steel.
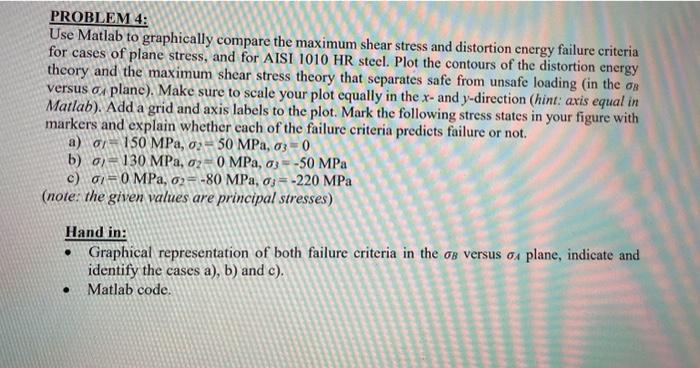
Use Matlab to graphically compare the maximum shear stress and distortion energy failure criteria for cases of plane stress, and for AISI 1010 HR steel. Plot the contours of the distortion energy theory and the maximum shear stress theory that separates safe from unsafe loading (in the B Matlab). Add a grid and axis labels to the plot. Mark the following stress states in your figure with markers and explain whether each of the failure criteria predicts failure or not. a) 1=150MPa,2=50MPa,3=0 b) 1=130MPa,2=0MPa,3=50MPa c) l=0MPa,2=80MPa,3=220MPa (note: the given values are principal stresses) Hand in: - Graphical representation of both failure criteria in the B versus A plane, indicate and identify the cases a), b) and c). - Matlab code
Step by Step Solution
There are 3 Steps involved in it

Get step-by-step solutions from verified subject matter experts