

Question: USE PYTHON (JUPYTER) Question 2b (4 marks) Given the code below, extend it to: Include a function prettyplot(...) with arguments xdata, ydata, xlabel, ylabel, title
USE PYTHON (JUPYTER)
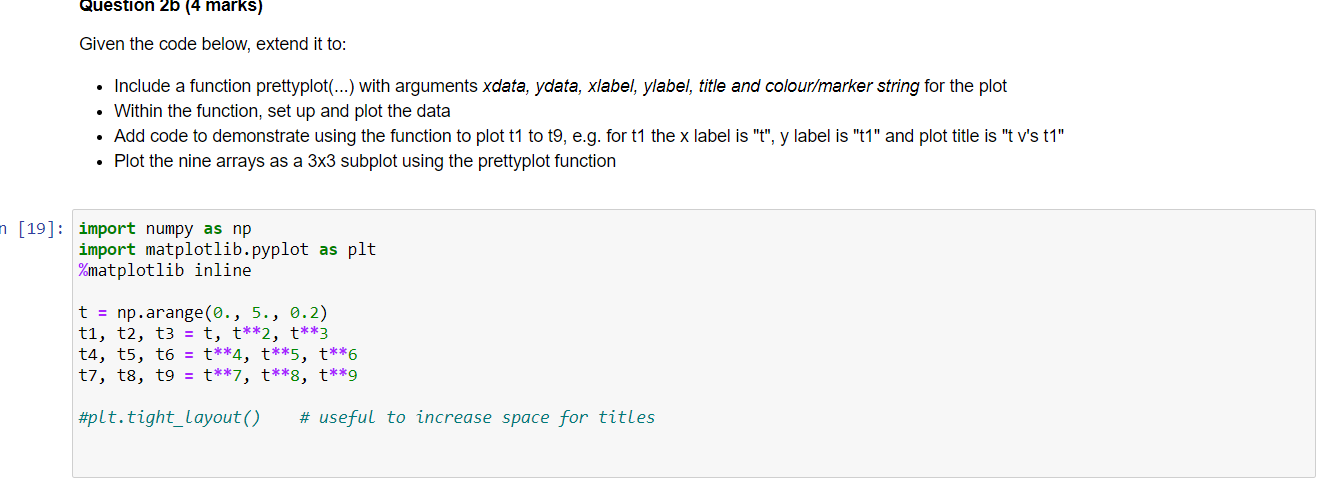
Question 2b (4 marks) Given the code below, extend it to: Include a function prettyplot(...) with arguments xdata, ydata, xlabel, ylabel, title and colour/marker string for the plot . Within the function, set up and plot the data Add code to demonstrate using the function to plot t1 to t9, e.g. for t1 the x label is "t", y label is "t1" and plot title is "tv's t1" Plot the nine arrays as a 3x3 subplot using the prettyplot function n (19]: import numpy as np import matplotlib.pyplot as plt %matplotlib inline t = np.arange(0., 5., 0.2) ti, t2, t3 = t, t**2, t**3 t4, t5, t6 = t**4, t**5, t**6 ti, t8, t9 = t**7, t**8, t**9 #plt.tight_layout() # useful to increase space for titles
Step by Step Solution
There are 3 Steps involved in it

Get step-by-step solutions from verified subject matter experts