

Question: USE PYTHON TO SOLVE THESE QUESTIONS. LINK TO THE SHIP.CSV FILE : https://drive.google.com/file/d/1aMC7xKtZwz_bNYkTatpOL0l6Pywk-dB8/view?usp=sharing Questinn ] Prepare the ship data stored in ship_csv for Jture analytics
USE PYTHON TO SOLVE THESE QUESTIONS.
LINK TO THE SHIP.CSV FILE:https://drive.google.com/file/d/1aMC7xKtZwz_bNYkTatpOL0l6Pywk-dB8/view?usp=sharing
![USE PYTHON TO SOLVE THESE QUESTIONS.LINK TO THE SHIP.CSV FILE:https://drive.google.com/file/d/1aMC7xKtZwz_bNYkTatpOL0l6Pywk-dB8/view?usp=sharing Questinn ]](https://dsd5zvtm8ll6.cloudfront.net/si.experts.images/questions/2024/10/670ff1c9ebfd0_185670ff1c9dbd1e.jpg)
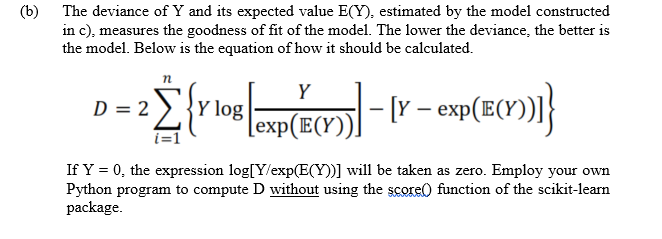
Questinn ] Prepare the ship data stored in "ship_csv" for Jture analytics tasks using rnctions and methods of NumPy and pandas= respectively. (a) Design your own Python program to carry out the following tasks: (1} arm "shipCW\" as Pandas Mme call "5hip\"- mam am observations where MS and Y are "." to indicate that they are missing values= declare this character as missing values in your program accordingly. (ii) Since the variable names of this dataset are rather short and do not really describe the nature of the variables, rename the ship types to "types", construction years to "m", operation periods to "W: the aggregated months of service to "WI: and the mrmber of incidents to "incidents". (iilj For better understanding ofthe data, compute the average service months and the average number of incidents for the crossproducts of every category in types and operation periods- The averages should be rounded to the nearest integers. Store the resulting table to an object named "WK {iv} Replace the missing yalues in the variable "W" and "inc-ideals" by the respective means of the other ships that share the same type AND the same operation period. Add comments to elaborate your Python program as well. (v) Construct a Python program to save the target variable "incidents" in a pandas mms "T'- (b) Except for the months of service and number of incidents, all the other variables, including "types", "c. years", and "o periods" are actually nominal and not interval ratio. (1) Perform an appropriate data type conversion for these variables so that they can be recognised as categorical variables. (ii) Construct Python code to convert all categorical variables to dummy variables and save the result as a pandas DataFrame named "X" (iii) Researchers suggest that the aggregated months of service of each ship must be scaled down due to its wide range of values. Perform a log-transformation of this variable in the DataFrame and name the transformed variable "log s. months" The transformed variable should be attached to both DataFrames "X" and "ship". (d) We shall now save the prepared DataFrame "ship" as a new cav text file called "ship_prepared.csv". Furthermore, we shall also create a database called "ship.db" and export the DataFrame to the database as tables. Write a Python program to carry out these two tasks.Question 2 In their book Generalized Linear Models (New York: Chapman & Hall, 1983), the authors P. McCullagh and J.A. Nelder used the Poisson regression to study the ship dataset. Poisson regression is a special case of the generalised linear models in which the target variable, or dependent variable, is Poisson distributed. Since one of the main application areas of Poisson regression is to fit linear models on count data, we can therefore use Poisson regression to predict the number of incidents (which are also counts) given some input variables. Mathematically, Poisson regression is a linear model in which the expected value of the target variable Y is calculated by log E(Y) = Bo + B1X1 + B2X2 + ...+ BKXk. where Bo is the intercept, BI, B2, ... , Pk are the coefficients of the independent variables X1, X2, ..., Xk. E(Y) is the predicted, or expected value of Y, which will be transformed by the natural logarithm function. (a) Analyse the data by fitting a Poisson regression based on the DataFrames X and Y generated in Question 1. Follow the instruction in the official website and report the parameters of the estimated model. Create a Python program to fit a Poisson regression and generate a table or a DataFrame to present the coefficients with the corresponding labels.(b) The deviance of Y and its expected value E(Y), estimated by the model constructed in c), measures the goodness of fit of the model. The lower the deviance, the better is the model. Below is the equation of how it should be calculated. n D = 2X Y Y log exp ( IE (X ) ) -[Y - exp(E(Y) )] If Y = 0, the expression log[Y/exp(E(Y))] will be taken as zero. Employ your own Python program to compute D without using the score() function of the scikit-learn package
Step by Step Solution
There are 3 Steps involved in it

Get step-by-step solutions from verified subject matter experts