

Question: Use R code to solve the problem Question3 For Question 3, use the data in Shillerdata.csv, which contains the monthly closing price, dividends, earnings, and
Use R code to solve the problem
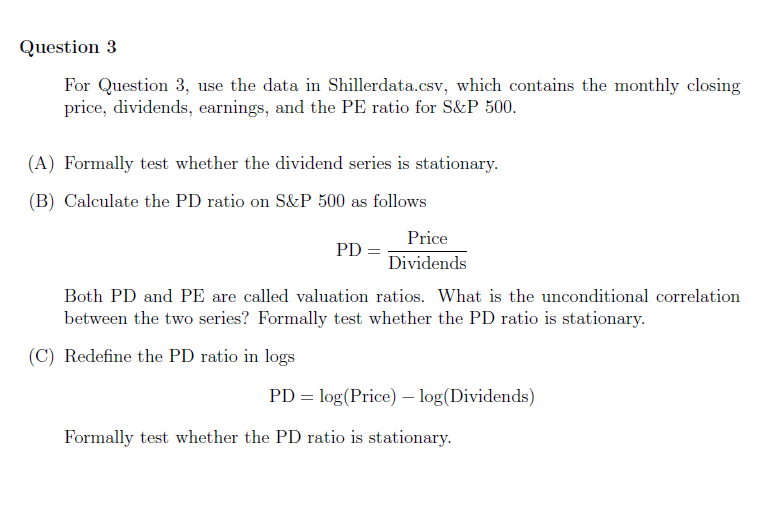
Question3 For Question 3, use the data in Shillerdata.csv, which contains the monthly closing price, dividends, earnings, and the PE ratio for SkP 500 A) Formally test whether the dividend series is stationary. (B) Calculate the PD ratio on S&P 500 as follows Price Dividends Both PD and PE are called valuation ratios. What is the unconditional correlation between the two series? Formally test whether the PD ratio is stationary. (C) Redefine the PD ratio in logs PD log(Price) log(Dividends) Formally test whether the PD ratio is stationary. Question3 For Question 3, use the data in Shillerdata.csv, which contains the monthly closing price, dividends, earnings, and the PE ratio for SkP 500 A) Formally test whether the dividend series is stationary. (B) Calculate the PD ratio on S&P 500 as follows Price Dividends Both PD and PE are called valuation ratios. What is the unconditional correlation between the two series? Formally test whether the PD ratio is stationary. (C) Redefine the PD ratio in logs PD log(Price) log(Dividends) Formally test whether the PD ratio is stationary
Step by Step Solution
There are 3 Steps involved in it

Get step-by-step solutions from verified subject matter experts