

Question: use semilog graph paper to hand plot the data 4 ) Drawdown, s , was observed in a well located 5 0 ft rom a
use semilog graph paper to hand plot the data
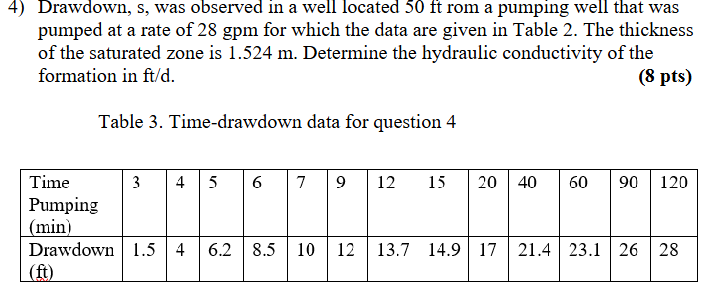
Drawdown, s was observed in a well located ft rom a pumping well that was pumped at a rate of gpm for which the data are given in Table The thickness of the saturated zone is m Determine the hydraulic conductivity of the formation in mathrmftmathrmd
pts
Table Timedrawdown data for question
begintabularllllllllllllll
hline begintabularl
Time
Pumping
min
endtabular & & & & & & & & & & & & &
hline begintabularl
Drawdown
mathrmft
endtabular & & & & & & & & & & & & &
hline
endtabular
Step by Step Solution
There are 3 Steps involved in it
1 Expert Approved Answer
Step: 1 Unlock

Question Has Been Solved by an Expert!
Get step-by-step solutions from verified subject matter experts
Step: 2 Unlock
Step: 3 Unlock