

Question: Use the bode command in MATLAB to plot the Bode plots of the following transfer functions. Carefully observe how different terms modify the Bode
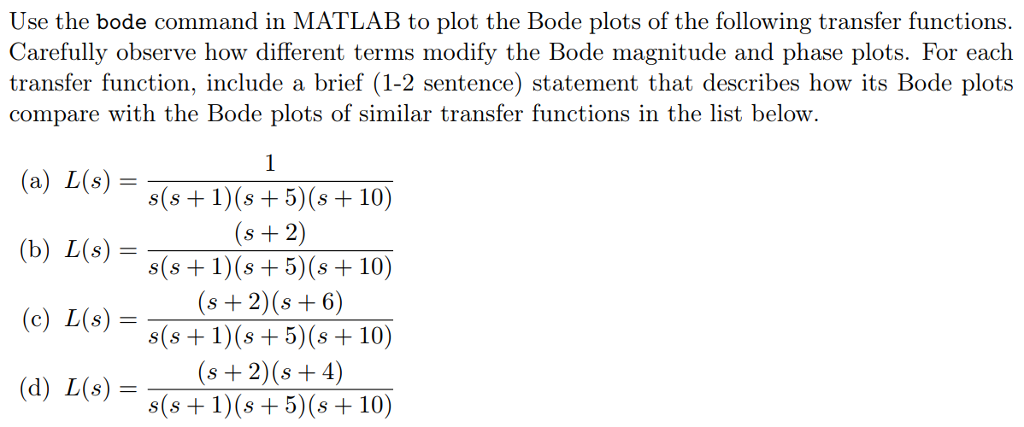
Use the bode command in MATLAB to plot the Bode plots of the following transfer functions. Carefully observe how different terms modify the Bode magnitude and phase plots. For each transfer function, include a brief (1-2 sentence) statement that describes how its Bode plots compare with the Bode plots of similar transfer functions in the list below. (a) L(s) = (b) L(s) = = (c) L(s) (d) L(s) = = 1 s(s+ 1)(s+5)(s + 10) (s+2) s(s+1)(s+5)(s+10) (s+2)(s+6) s(s+ 1)(s+5)(s + 10) (s+2)(s+4) s(s+ 1)(s+5)(s + 10)
Step by Step Solution
★★★★★
3.45 Rating (148 Votes )
There are 3 Steps involved in it
1 Expert Approved Answer
Step: 1 Unlock

Question Has Been Solved by an Expert!
Get step-by-step solutions from verified subject matter experts
Step: 2 Unlock
Step: 3 Unlock