

Question: Use the continuous numerical data provided to create a histogram and a line plot (frequency polygon) using EXCEL or R. Use your best judgement when
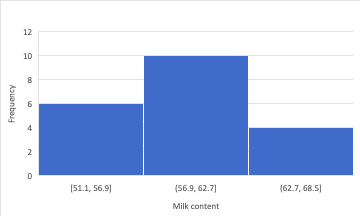
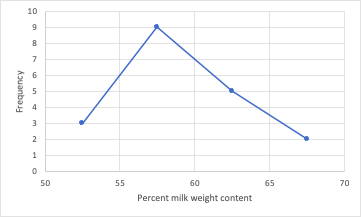
Use the continuous numerical data provided to create a histogram and a line plot (frequency polygon) using EXCEL or R. Use your best judgement when selecting appropriate bin widths and axis labels. Provide an informative figure caption for each plot.!!!
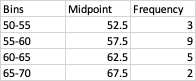
Data description: This dataset measures the milk produced (kg) in one day for 20 holstein cows. All cows were housed at the research station dairy facility.
\f12 10 Abuan baty 6 [51.1, 56.9] (56.9, 62.7] (62 7, 68.5] Milk content10 9 Frequency 50 55 60 65 70 Percent milk weight content
Step by Step Solution
There are 3 Steps involved in it
1 Expert Approved Answer
Step: 1 Unlock

Question Has Been Solved by an Expert!
Get step-by-step solutions from verified subject matter experts
Step: 2 Unlock
Step: 3 Unlock