

Question: Use the nominal categorical data provided to create a barplot based on the number of observations per category using EXCEL or R. Use your best
Use the nominal categorical data provided to create a barplot based on the number of observations per category using EXCEL or R. Use your best judgement when selecting appropriate axis labels and the axis scale. Provide an informative figure caption for the plot.
Data description: This dataset records the identity of all 22 surviving weeds in a test plot post-herbicide application. The trial was performed at the research farm. All 22 surviving weeds were then collected for resistance testing.
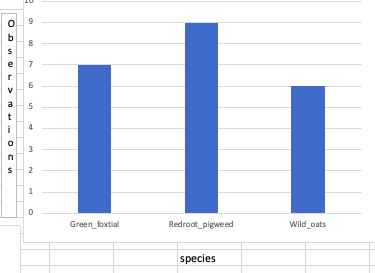
4 1 Green foxtial Redroot_pigweed Wild oats species
Step by Step Solution
There are 3 Steps involved in it
1 Expert Approved Answer
Step: 1 Unlock

Question Has Been Solved by an Expert!
Get step-by-step solutions from verified subject matter experts
Step: 2 Unlock
Step: 3 Unlock