

Question: Use the bivariate data provided to create a barplot and a boxplot using EXCEL or R. Use your best judgement when selecting appropriate axis labels
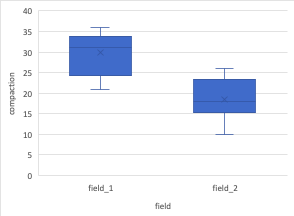
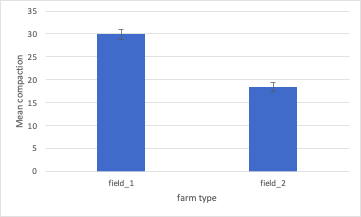
Use the bivariate data provided to create a barplot and a boxplot using EXCEL or R. Use your best judgement when selecting appropriate axis labels and the axis scale. Provide an informative figure caption for each plot.
\f\f
Step by Step Solution
There are 3 Steps involved in it
1 Expert Approved Answer
Step: 1 Unlock

Question Has Been Solved by an Expert!
Get step-by-step solutions from verified subject matter experts
Step: 2 Unlock
Step: 3 Unlock