

Question: Use the daily data for IBM below: RIBM is the log return of IBM adjusted closing prices. Is there evidence of volatility clustering using 15
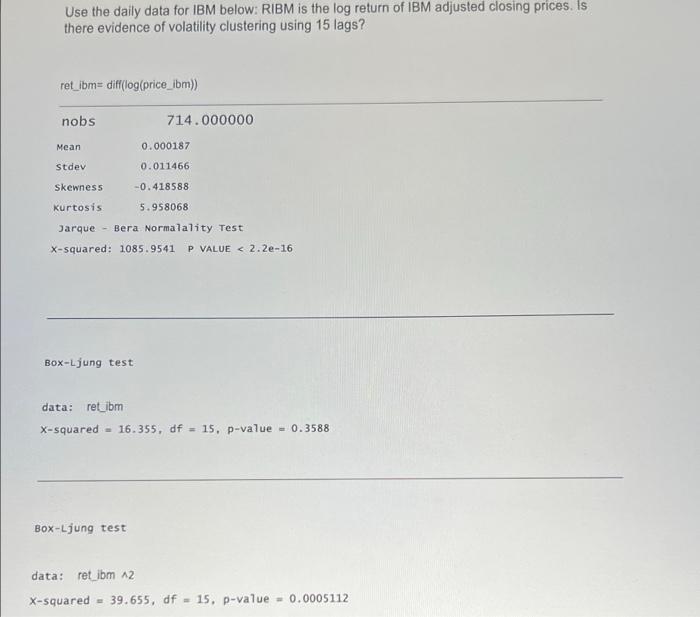
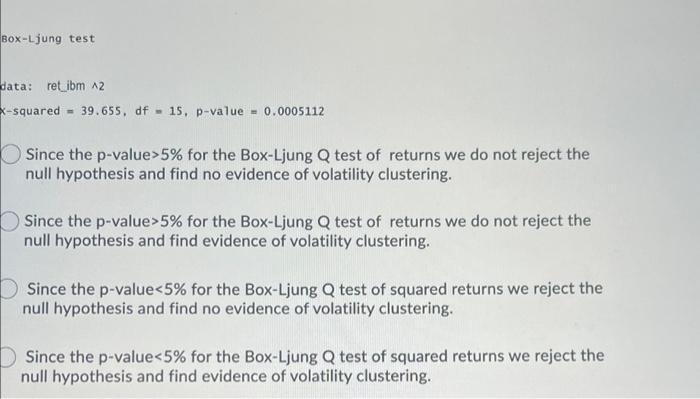
Use the daily data for IBM below: RIBM is the log return of IBM adjusted closing prices. Is there evidence of volatility clustering using 15 lags? ret_ibm= diff(log(price_ibm)) nobs 714.000000 Mean 0.000187 Stdev 0.011466 Skewness -0.418588 Kurtosis 5.958068 Jarque - Bera Normalality Test X-squared: 1085.9541 P VALUE 5% for the Box-Ljung Q test of returns we do not reject the null hypothesis and find no evidence of volatility clustering. Since the p-value>5% for the Box-Ljung Q test of returns we do not reject the null hypothesis and find evidence of volatility clustering. Since the p-value
Step by Step Solution
There are 3 Steps involved in it
1 Expert Approved Answer
Step: 1 Unlock

Question Has Been Solved by an Expert!
Get step-by-step solutions from verified subject matter experts
Step: 2 Unlock
Step: 3 Unlock