

Question: Use the data from Q3 to create two active portfolios that will be designed to take advantage of a bull market over the next 3
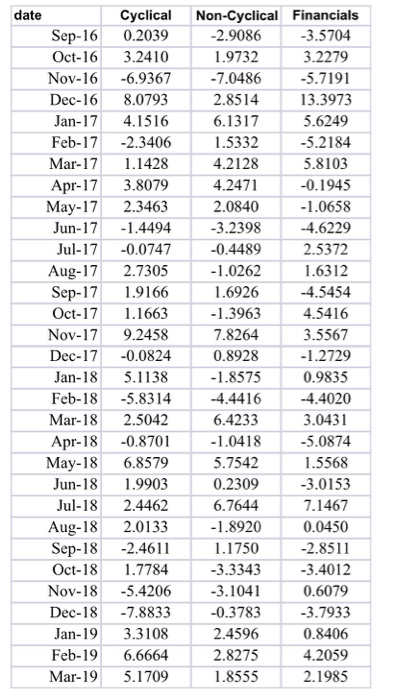
date Sep-16 Oct-16 Nov-16 Dec-16 Jan-17 Feb-17 Mar-17 Apr-17 May-17 Jun-17 Jul-17 Aug-17 Sep-17 Oct-17 Nov-17 Dec-17 Jan-18 Feb-18 Mar-18 Apr-18 May-18 Jun-18 Jul-18 Aug-18 Sep-18 Oct-18 Nov-18 Dec-18 Jan-19 Feb-19 Mar-19 Cyclical 0.2039 3.2410 -6.9367 8.0793 4.1516 -2.3406 1.1428 3.8079 2.3463 -1.4494 -0.0747 2.7305 1.9166 1.1663 9.2458 -0.0824 5.1138 -5.8314 2.5042 -0.8701 6.8579 1.9903 2.4462 2.0133 -2.4611 1.7784 -5.4206 -7.8833 3.3108 6.6664 5.1709 Non-Cyclical Financials -2.9086 -3.5704 1.9732 3.2279 -7.0486 -5.7191 2.8514 13.3973 6.1317 5.6249 1.5332 -5.2184 4.2128 5.8103 4.2471 -0.1945 2.0840 -1.0658 -3.2398 -4.6229 -0.4489 2.5372 - 1.0262 1.6312 1.6926 -4.5454 -1.3963 4.5416 7.8264 3.5567 0.8928 -1.2729 -1.8575 0.9835 -4.4416 -4.4020 6.4233 3.0431 -1.0418 -5.0874 5.7542 1.5568 0.2309 -3.0153 6.7644 7.1467 -1.8920 0.0450 1.1750 -2.8511 -3.3343 -3.4012 -3.1041 0.6079 -0.3783 -3.7933 2.4596 0.8406 2.8275 4.2059 1.8555 2.1985 date Sep-16 Oct-16 Nov-16 Dec-16 Jan-17 Feb-17 Mar-17 Apr-17 May-17 Jun-17 Jul-17 Aug-17 Sep-17 Oct-17 Nov-17 Dec-17 Jan-18 Feb-18 Mar-18 Apr-18 May-18 Jun-18 Jul-18 Aug-18 Sep-18 Oct-18 Nov-18 Dec-18 Jan-19 Feb-19 Mar-19 Cyclical 0.2039 3.2410 -6.9367 8.0793 4.1516 -2.3406 1.1428 3.8079 2.3463 -1.4494 -0.0747 2.7305 1.9166 1.1663 9.2458 -0.0824 5.1138 -5.8314 2.5042 -0.8701 6.8579 1.9903 2.4462 2.0133 -2.4611 1.7784 -5.4206 -7.8833 3.3108 6.6664 5.1709 Non-Cyclical Financials -2.9086 -3.5704 1.9732 3.2279 -7.0486 -5.7191 2.8514 13.3973 6.1317 5.6249 1.5332 -5.2184 4.2128 5.8103 4.2471 -0.1945 2.0840 -1.0658 -3.2398 -4.6229 -0.4489 2.5372 - 1.0262 1.6312 1.6926 -4.5454 -1.3963 4.5416 7.8264 3.5567 0.8928 -1.2729 -1.8575 0.9835 -4.4416 -4.4020 6.4233 3.0431 -1.0418 -5.0874 5.7542 1.5568 0.2309 -3.0153 6.7644 7.1467 -1.8920 0.0450 1.1750 -2.8511 -3.3343 -3.4012 -3.1041 0.6079 -0.3783 -3.7933 2.4596 0.8406 2.8275 4.2059 1.8555 2.1985
Step by Step Solution
There are 3 Steps involved in it

Get step-by-step solutions from verified subject matter experts