

Question: Use the data in the following table, which lists carbon dioxide concentrations (in parts per million) for each year from 1960 to 2003, with projected
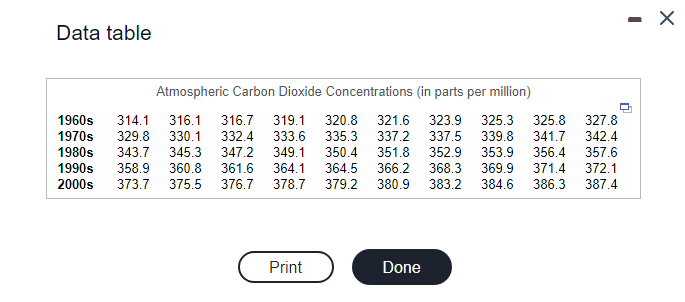
Use the data in the following table, which lists carbon dioxide concentrations (in parts per million) for each year from 1960 to 2003, with projected values used for the last four years. After finding the values of the mean and range for each decade, find the values of x, and A. Alse find the values of LCL and UCL for an R chart, and find the values of LCL and UCL for an x chart. E Click the icon to view the data table (Round to three decimal places as needed.) R I \f
Step by Step Solution
There are 3 Steps involved in it
1 Expert Approved Answer
Step: 1 Unlock

Question Has Been Solved by an Expert!
Get step-by-step solutions from verified subject matter experts
Step: 2 Unlock
Step: 3 Unlock