

Question: use the data in the second photo to make the X- bar and range chart. All the data needed is in the second photo. 30.
use the data in the second photo to make the X- bar and range chart. All the data needed is in the second photo. 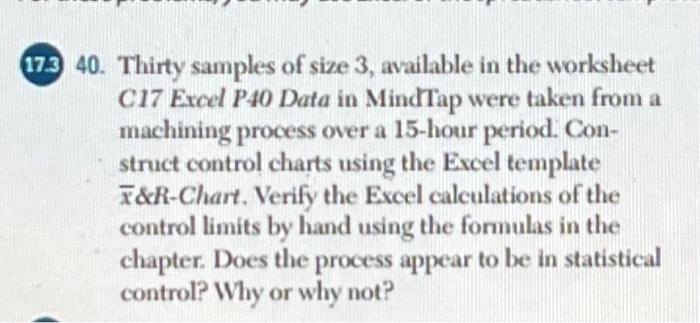
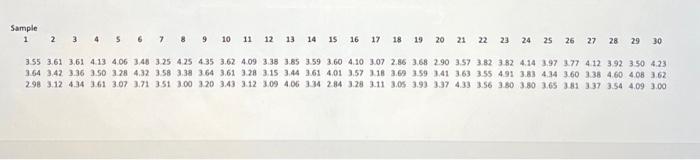
30. Thirty samples of size 3 , available in the worksheet C17 Excel P40 Data in MindTap were taken from a machining process over a 15-hour period. Construct control charts using the Excel template x&R-Chart. Verify the Excel calculations of the control limits by hand using the formulas in the chapter. Does the process appear to be in statistical control? Why or why not
Step by Step Solution
There are 3 Steps involved in it
1 Expert Approved Answer
Step: 1 Unlock

Question Has Been Solved by an Expert!
Get step-by-step solutions from verified subject matter experts
Step: 2 Unlock
Step: 3 Unlock