

Question: Use the data provided in problem 2. a. Starting with a forecast of 550 for quarter 1 , forecast the demand for quarter 13 using
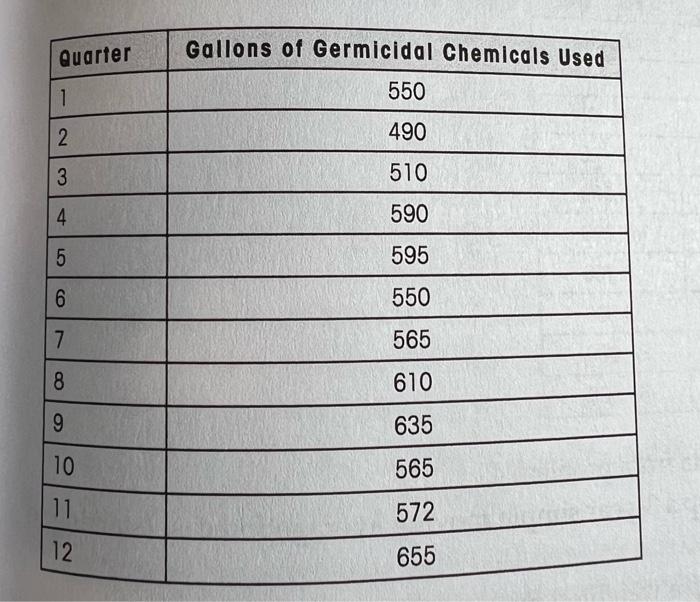
Use the data provided in problem 2. a. Starting with a forecast of 550 for quarter 1 , forecast the demand for quarter 13 using exponential smoothing with =0.6. Plot the actual data and the exponentially smoothed forecasts on the same graph. b. Forecast demand from quarter 2 to quarter 13 using the nave approach. Plot your forecasts on the graph developed in part a. \begin{tabular}{|l|c|} \hline Quarter & Gallons of Germicidal Chemicals Used \\ \hline 1 & 550 \\ \hline 2 & 490 \\ \hline 3 & 510 \\ \hline 4 & 590 \\ \hline 5 & 595 \\ \hline 6 & 550 \\ \hline 7 & 565 \\ \hline 8 & 610 \\ \hline 9 & 635 \\ \hline 10 & 565 \\ \hline 11 & 572 \\ \hline 12 & 655 \\ \hline \end{tabular}
Step by Step Solution
There are 3 Steps involved in it

Get step-by-step solutions from verified subject matter experts