

Question: Use the data provided to create two new variables containing the raw values of P and Q . The data in the Excel file is
- Use the data provided to create two new variables containing the raw values of Pand Q. The data in the Excel file is provided in natural logs. You need to convert the relevant variables to their actual values. Excel's EXP function does the inverse of the LN function, converting natural log numbers to raw numbers.
- Plot separate line charts for Pand Q, with time (in years) on the horizontal axis. Make sure to label your vertical axis appropriately.
- Create a table with the following columns:
- Column 1 (Q): Display arbitrary quantities, from 500 to 10,000, in intervals of 500.
- Column 2 (LogQ): Convert the values of Qin Column 1 to natural log format.
- Column 3 (LogP-supply): Compute the corresponding value of log Pfor the following supply function: log.
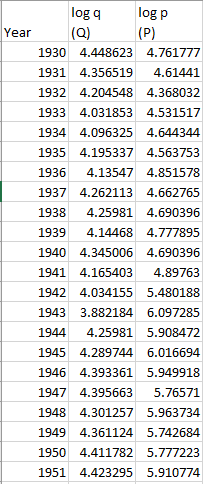
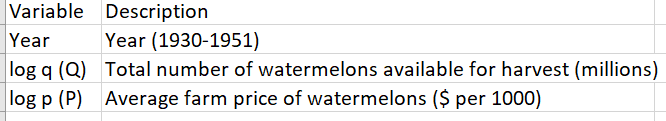
\fVariable Description Year Year (1930-1951] log q (Q) Total number of watermelons available for harvest (millions) log p (P) Average fa rm price of watermelons (S per 1000)
Step by Step Solution
There are 3 Steps involved in it
1 Expert Approved Answer
Step: 1 Unlock

Question Has Been Solved by an Expert!
Get step-by-step solutions from verified subject matter experts
Step: 2 Unlock
Step: 3 Unlock