

Question: Use the data shown in the graph to write a quadratic regression equation. Then predict the box office revenue in Box office revenue O 2012.
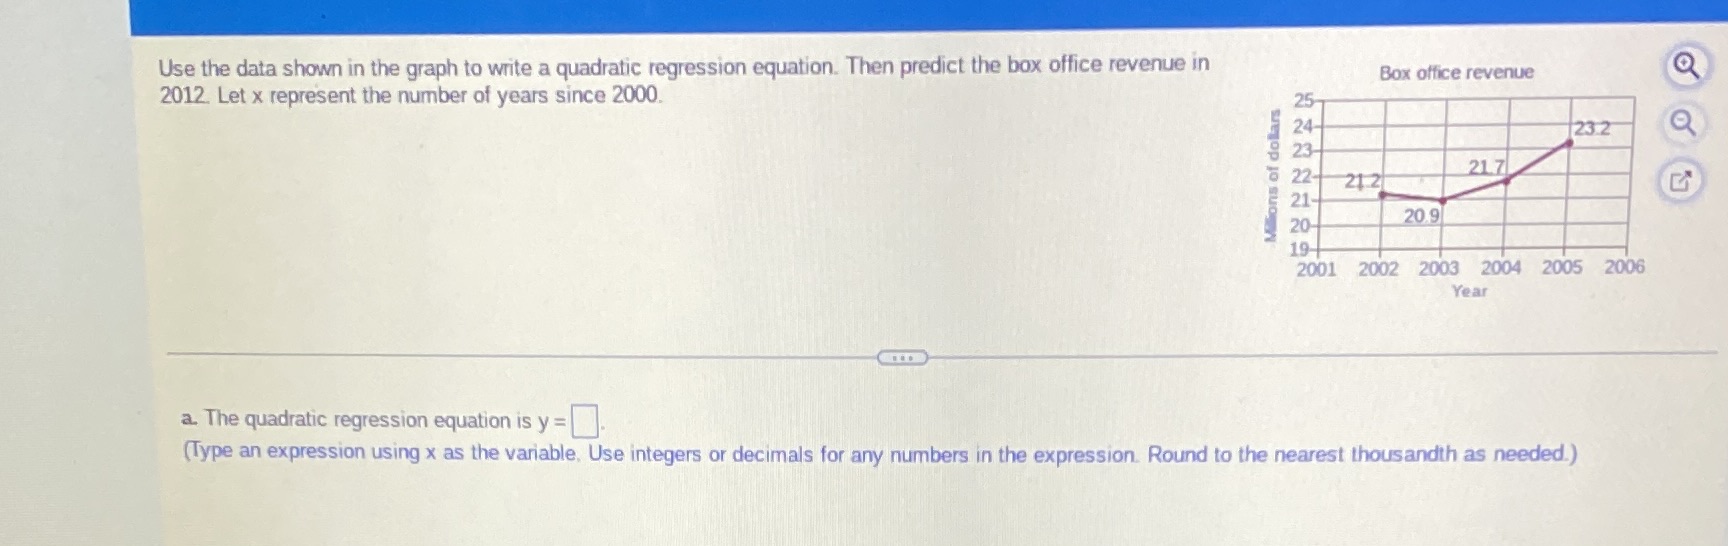
Use the data shown in the graph to write a quadratic regression equation. Then predict the box office revenue in Box office revenue O 2012. Let x represent the number of years since 2000. 23:2 21.7 Millions of dollars 21 2 20- 20.9 19- 2001 2002 2003 2004 2005 2006 Year a. The quadratic regression equation is y = (Type an expression using x as the variable, Use integers or decimals for any numbers in the expression. Round to the nearest thousandth as needed.)
Step by Step Solution
There are 3 Steps involved in it
1 Expert Approved Answer
Step: 1 Unlock

Question Has Been Solved by an Expert!
Get step-by-step solutions from verified subject matter experts
Step: 2 Unlock
Step: 3 Unlock