

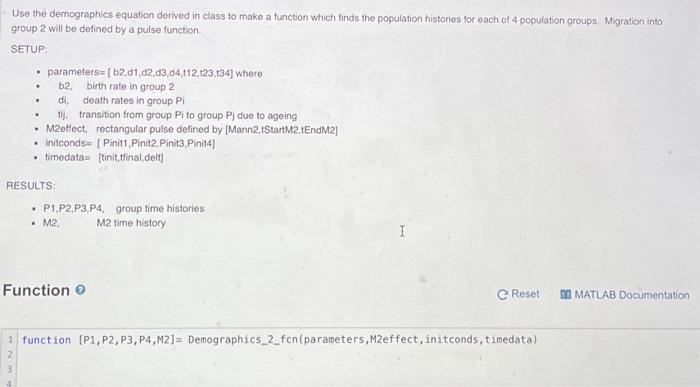
Question: Use the demographics equation derived in class to make a function which finds the population histories for each of 4 population groups. Migration into group
![(b2,01,02,13,14,112,123,134] where b2, birth rate in group 2 di death rates in](https://dsd5zvtm8ll6.cloudfront.net/si.experts.images/questions/2024/09/66f6ae907d7da_57666f6ae9016c69.jpg)

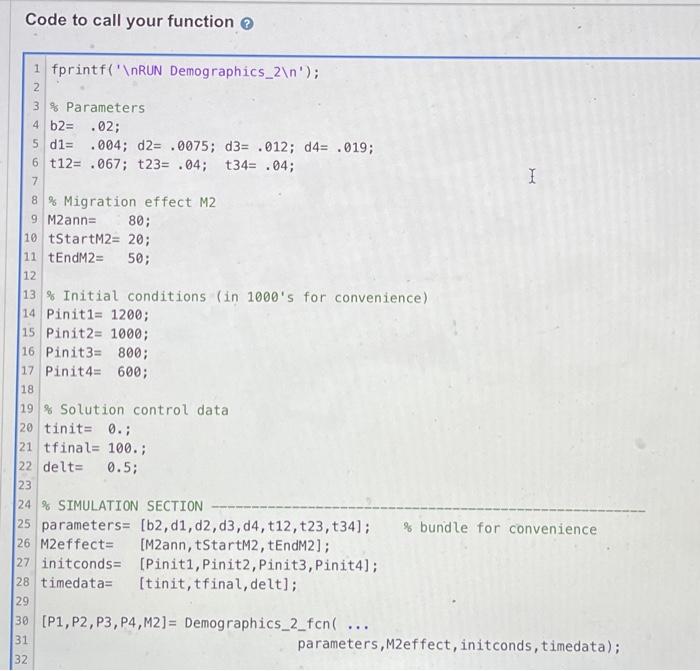
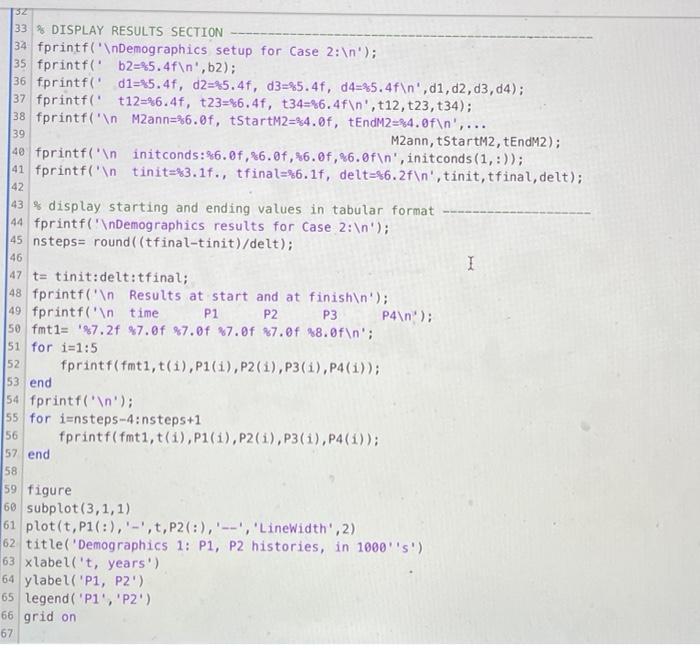
Use the demographics equation derived in class to make a function which finds the population histories for each of 4 population groups. Migration into group 2 will be defined by a pulse function SETUP parameters= (b2,01,02,13,14,112,123,134] where b2, birth rate in group 2 di death rates in group PI tij. transition from group Pito group Pj due to ageing M2effect, rectangular pulse defined by (Mann2tStartM2,tEndM2] Initconds- (Pinit1, Pinit2. Pinit3 Pinit4) timedata= [tinit.tfinal delt . . RESULTS: P1.P2,P3,P4, group time histories M2 M2 time history I Function Reset MATLAB Documentation 1 function (P1, P2, P3, P4,M2)= Demographics_2_fcn(parameters, M2effect, initconds, timedata) Code to call your function 1 fprintf(' RUN Demographics_2 '); 2 3 % Parameters 4 b2= .02; 5 d1= .004; d2= .0075; d3= .012; 04= .019; 6 t12= .067; t23= .04; t34= .04; 7 1 50; 8% Migration effect M2 9 M2ann= 80; 10 tStartM2= 20; 11 tEndM2= 12 13 % Initial conditions (in 1000's for convenience) 14 Pinit1= 1200; 15 Pinit2= 1000; 16 Pinit3: 800; 17 Pinit4 600; 18 19 % Solution control data 20 tinit= 0.; 21 tfinal= 100.; 22 delt= 0.5; 23 24 % SIMULATION SECTION 25 parameters= (b2, d1, d2, d3, 04, t12, t23, t34); % bundle for convenience 26 M2effect= [M2ann, tStartM2, tEndM2]; 27 initconds= (Piniti, Pinit2, Pinit3, Pinit4]; 28 timedata= (tinit, tfinal, delt]; 29 30 (P1, P2, P3, P4,M2)= Demographics_2_fcn ... 31 parameters,M2effect, initconds, timedata); 32 46 32 33 % DISPLAY RESULTS SECTION 34 fprintf(' Demographics setup for Case 2: '); 35 fprintf('b2=5.4f ',.2); 36 fprintf('d1=5.4f, d2=85.4f, d3=85.4f, d4=45.4f ', d1,02,03,04); 37 fprintf('t12=%6.4f, t23=%6.4f, t34=%6.4f ', t12, t23, t34); 38 fprintf(" Mann=86.0f, tStartM2=84.0f, tEndM2=24.0f ',... 39 M2ann, tStartM2, tEndM2); 40 fprintf(" initconds: 6.0f %6.0f,%6.0f, 26.0f ', initconds(1,:)); 41 fprintf(' tinit=83.16., tfinal=86.1f, delt=86.2f ', tinit, tfinal, delt); 42 43% display starting and ending values in tabular format 44 fprintf(' Demographics results for Case 2: '); 45 nsteps= round((tfinal-tinit)/delt); I 47 t= tinit:delt:tfinal; 48 fprintf(' Results at start and at finish '); 49 fprintf(' time P1 P2 P3 P4 '); 50 fmt1= 27.2f $7.0f %7.0f %7.0f %7.0f $8.0f '; $1 for i=1:5 52 fprintf(fmti, t(1),P1(1),P2(1),P3(1),P4(1)); 53 end 54 fprintf(' '); 55 for i=nsteps-4:nsteps+1 56 fprintf(fmti, t(1),P1(1),P2(1),P3(i), P4(1)); 57 end 58 59 figure 60 subplot(3,1,1) 61 plot(t, P1(:),'-',t,P2 (:),'--', 'LineWidth', 2) 62 title('Demographics 1: P1, P2 histories, in 1000's) 63 xlabel('t, years') 64 ylabel('P1, P2') 65 legend( 'P','P2') 66 grid on 67 68 subplot(3,1,2) 69 plot(t,P1(:),'-',t,P2(:),'--',t,P3(:),'-,',t,P4(:),':', 'LineWidth', 2) 70 title('P1, P2, P3, P4 histories, in 1000''S') 71 label('t, years') 72 ylabel('P1, P2, P3, P4') 73 legend('P1','P2','P3','P4') 74 grid on 75 76 subplot(3,1,3) 77 plot(t,M2,'-', 'LineWidth', 2) 78 title('Migration effect M2, in 1000''S') 79 %xlabel('t, years') 80 ylabel('M2') 81 grid on 82 83 fprintf(' ') 1 I 84 % Assessment: M2 is correct P1 is Correct P2 is Correct M2 is correct P1 is Correct P2 is Correct P3 is correct P4 is correct
Step by Step Solution
There are 3 Steps involved in it

Get step-by-step solutions from verified subject matter experts