

Question: Use the demographics equation derived in class to make a function which finds the population histories for each of 4 population groups. Migration into group
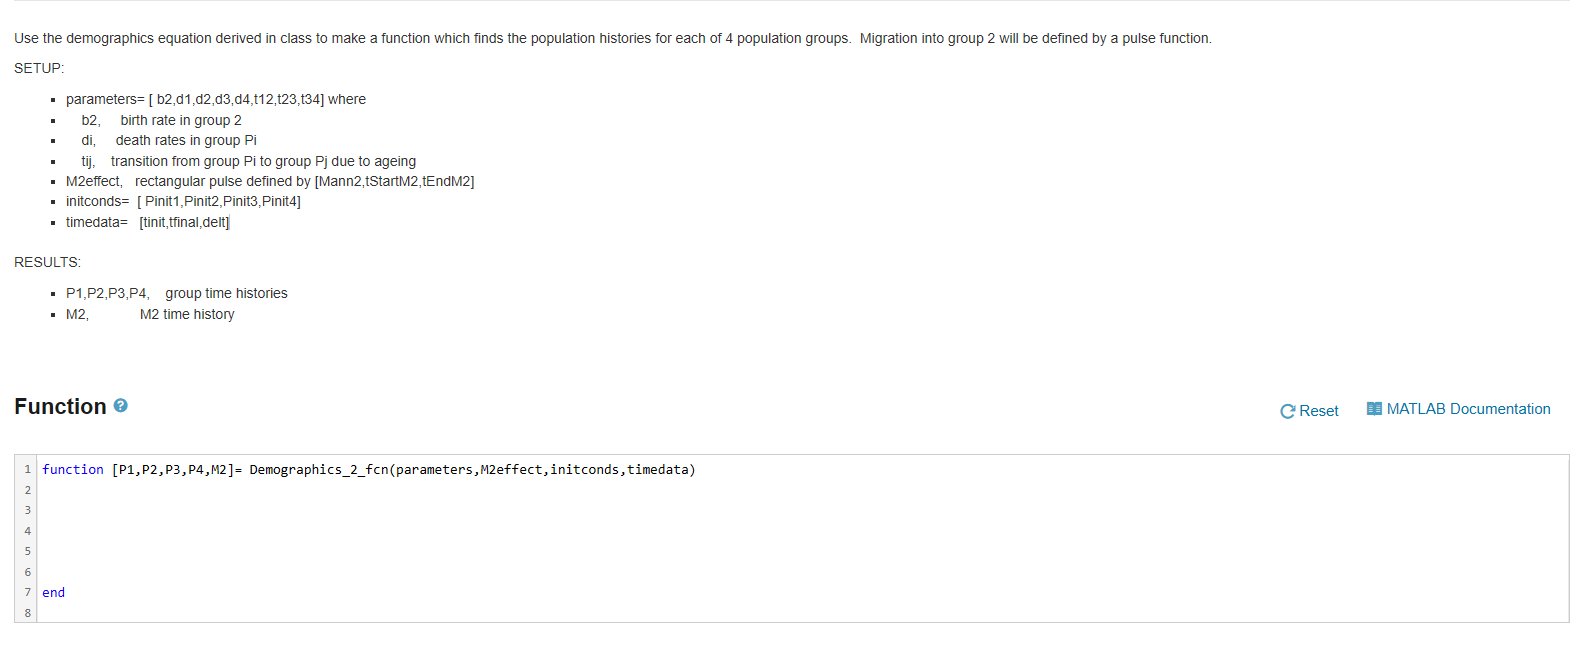
Use the demographics equation derived in class to make a function which finds the population histories for each of 4 population groups. Migration into group 2 will be defined by a pulse function.
SETUP:
parameters= [ b2,d1,d2,d3,d4,t12,t23,t34] where
b2, birth rate in group 2
di, death rates in group Pi
tij, transition from group Pi to group Pj due to ageing
M2effect, rectangular pulse defined by [Mann2,tStartM2,tEndM2]
initconds= [ Pinit1,Pinit2,Pinit3,Pinit4]
timedata= [tinit,tfinal,delt]
RESULTS:
P1,P2,P3,P4, group time histories
M2, M2 time history
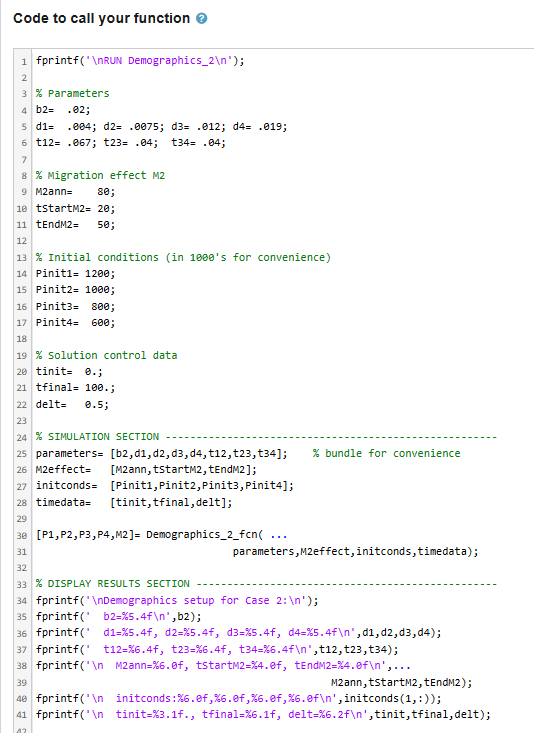
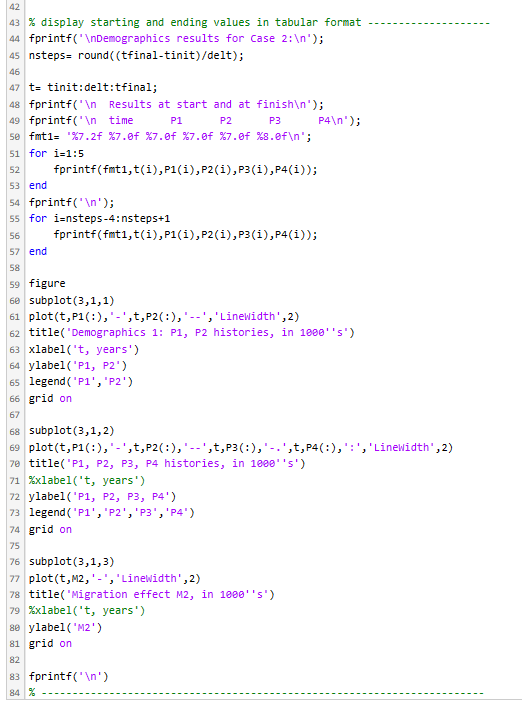
Use the demographics equation derived in class to make a function which finds the population histories for each of 4 population groups. Migration into group 2 will be defined by a pulse function. SETUP: - parameters =[b2,d1,d2,d3,d4,t12,t23,t34] where - b2, birth rate in group 2 - di, death rates in group Pi - tij, transition from group Pi to group Pj due to ageing - M2effect, rectangular pulse defined by [Mann2,tStartM2,tEndM2] - initconds= [Pinit1,Pinit2,Pinit3,Pinit4] - timedata =[ tinit,tfinal,delt ] RESULTS: - P1,P2,P3,P4, group time histories - M2, M2 time history Function ? \begin{tabular}{|l|l} \hline 1 & function [P1,P2,P3,P4,M2]= Demographics_2_fcn(parameters, M2effect, initconds, timedata) \\ 2 & \\ 3 & \\ 4 & \\ 5 & \\ 6 & \\ 7 & end \\ 8 & \end{tabular} ode to call your function? 42 \% display starting and ending values in tabular format fprintf(" \ ndemographics results for Case 2: ); nsteps = round (( tfinal-tinit )/delt); t= tinit: delt:tfinal; fprintf(' h Results at start and at finish ); fprintf(' f time P1 P2 P3 P4 P 1n); fmt1 =%7.2f%7.0f%7.0f%7.0f%7.0f%8.0f "; for i=1:5 fprintf(fmt 1,t(i),P1(i),P2(i),P3(i),P4(i)); end fprintf(' ); for i=nsteps4: nsteps +1 fprintf(fmt 1,t(i),P1(i),P2(i),P3(i),P4(i)); end figure subplot (3,1,1) plot(t,P1(:),,t,P2(:),,Linewidth,2) title("Demographics 1: P1, P2 histories, in 18005 ) xlabel ("t, years') ylabel ("P1, P2") legend ( P1 ', "P2') grid on subplot (3,1,2) plot(t,P1(:)," -',t,P2(:)," -',t,P3(:)," ',t,P4(:),":','Linewidth ,2,2) title("P1, P2, P3, P4 histories, in 18Q05 ) %xlabel("t, years') ylabel ('P1, P2, P3, P4') legend ( P1, " 2 ', 'P3', 'P4') grid on subplot (3,1,3) plot (t,M2, ' - ", "Linewidth', 2) title ("Migration effect M2, in 1080s ) %xlabel("t, years') ylabel( " M2 ) grid on fprintf(' 1n) %
Step by Step Solution
There are 3 Steps involved in it

Get step-by-step solutions from verified subject matter experts