

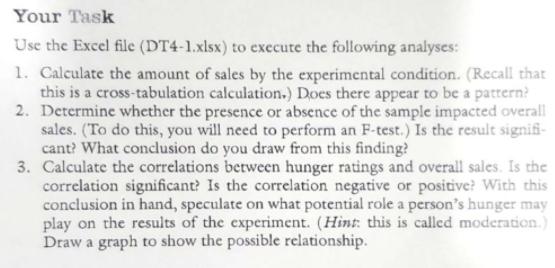
Use the Excel file (DT4-1.xlsx) to execute the following analyses: 1. Calculate the amount of sales...
Fantastic news! We've Found the answer you've been seeking!
Question:
Transcribed Image Text:
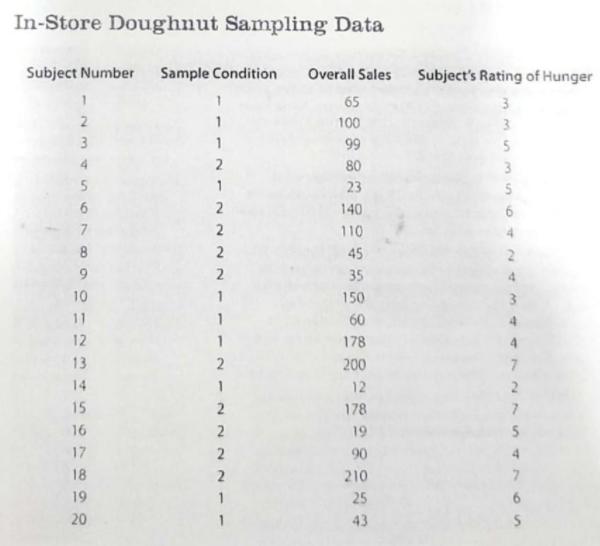
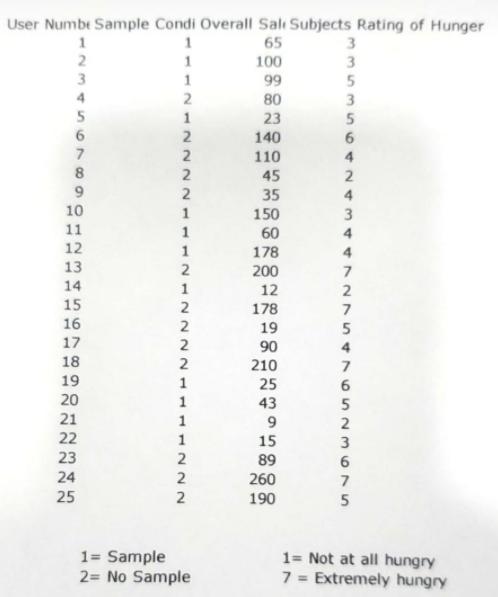
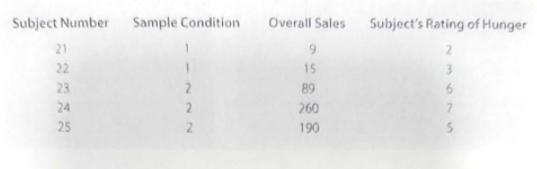
Use the Excel file (DT4-1.xlsx) to execute the following analyses: 1. Calculate the amount of sales by the experimental condition. (Recall that this is a cross-tabulation calculation.) Does there appear to be a pattern? Continuing from the scenario from the Marketing Application feature above, let's say you conducted an experiment to examine how an in-store sampling campaign may influence overall store sales. Column 1 shows the subject number. Column 2 indicates the sample con- dition for the independent variable of whether the subject received a doughnut sample or not. (1 = no sample; 2 = sample). Column 3 indicates the amount of overall sales the subject purchased in the store (in $). Column 4 indicates the subject's rating of hunger upon entering the store (ranging from1 = not at all hungry to 7 = extremely hungry). In-Store Doughnut Sampling Data Subject Number Sample Condition Overall Sales Subject's Rating of Hunger 65 2 1 100 3 1 99 4 2 80 3 23 2 140 7 2 110 8 2 45 2. 2 35 10 1 150 3. 11 1 60 4. 12 178 4 13 200 7 14 12 2 15 2 178 16 2 19 17 2 90 4 18 210 19 1 25 6. 20 1 43 706 User Numbt Sample Condi Overall Salı Subjects Rating of Hunger 65 1 3 100 3 3 99 4 80 3 5 1 23 5 6 140 110 8 45 9. 2 35 4 10 150 3 11 60 4 12 178 4 13 200 14 1 12 178 15 7 16 17 2 19 5 2 90 210 4 18 2 7 19 25 20 1 43 5 21 9. 15 2 22 1 23 89 24 2 260 7 25 190 1= Sample 2= No Sample 1= Not at all hungry 7 = Extremely hungry NNNN 1112 Subject Number Sample Condition Overall Sales Subject's Rating of Hunger 21 2. 22 15 3. 23 2 89 2. 2. 24 260 25 190 5. Your Task Use the Excel file (DT4-1.xlsx) to execute the following analyses: 1. Calculate the amount of sales by the experimental condition. (Recall that this is a cross-tabulation calculation.) Does there appear to be a patrern? 2. Determine whether the presence or absence of the sample impacted overall sales. (To do this, you will need to perform an F-test.) Is the result signifi- cant? What conclusion do you draw from this finding? 3. Calculate the correlations between hunger ratings and overall sales. Is the correlation significant? Is the correlation negative or positive? With this conclusion in hand, speculate on what potential role a person's hunger may play on the results of the experiment. (Hint: this is called moderation.) Draw a graph to show the possible relationship. Use the Excel file (DT4-1.xlsx) to execute the following analyses: 1. Calculate the amount of sales by the experimental condition. (Recall that this is a cross-tabulation calculation.) Does there appear to be a pattern? Continuing from the scenario from the Marketing Application feature above, let's say you conducted an experiment to examine how an in-store sampling campaign may influence overall store sales. Column 1 shows the subject number. Column 2 indicates the sample con- dition for the independent variable of whether the subject received a doughnut sample or not. (1 = no sample; 2 = sample). Column 3 indicates the amount of overall sales the subject purchased in the store (in $). Column 4 indicates the subject's rating of hunger upon entering the store (ranging from1 = not at all hungry to 7 = extremely hungry). In-Store Doughnut Sampling Data Subject Number Sample Condition Overall Sales Subject's Rating of Hunger 65 2 1 100 3 1 99 4 2 80 3 23 2 140 7 2 110 8 2 45 2. 2 35 10 1 150 3. 11 1 60 4. 12 178 4 13 200 7 14 12 2 15 2 178 16 2 19 17 2 90 4 18 210 19 1 25 6. 20 1 43 706 User Numbt Sample Condi Overall Salı Subjects Rating of Hunger 65 1 3 100 3 3 99 4 80 3 5 1 23 5 6 140 110 8 45 9. 2 35 4 10 150 3 11 60 4 12 178 4 13 200 14 1 12 178 15 7 16 17 2 19 5 2 90 210 4 18 2 7 19 25 20 1 43 5 21 9. 15 2 22 1 23 89 24 2 260 7 25 190 1= Sample 2= No Sample 1= Not at all hungry 7 = Extremely hungry NNNN 1112 Subject Number Sample Condition Overall Sales Subject's Rating of Hunger 21 2. 22 15 3. 23 2 89 2. 2. 24 260 25 190 5. Your Task Use the Excel file (DT4-1.xlsx) to execute the following analyses: 1. Calculate the amount of sales by the experimental condition. (Recall that this is a cross-tabulation calculation.) Does there appear to be a patrern? 2. Determine whether the presence or absence of the sample impacted overall sales. (To do this, you will need to perform an F-test.) Is the result signifi- cant? What conclusion do you draw from this finding? 3. Calculate the correlations between hunger ratings and overall sales. Is the correlation significant? Is the correlation negative or positive? With this conclusion in hand, speculate on what potential role a person's hunger may play on the results of the experiment. (Hint: this is called moderation.) Draw a graph to show the possible relationship.
Expert Answer:
Answer rating: 100% (QA)
1 amount of sales by the experimental condition Sample condition 1 2 Total sales 779 ... View the full answer

Posted Date:
Students also viewed these marketing questions
-
Question 3. (MCQ) [2.5] What is the form of the complete partial fractions decomposition of this function: 2x + 1 (x+4) (x 1)(x 3) - B (x+4) Ax+B Cr+D + A. 44+ C. Ar+B (x+4) D. Ar+B (x+4) E. + + ++...
-
Does there appear to be an association between hand span and number of Tootsie Rolls? Describe the direction, form, and strength of the association: Is it positive, negative, weak, strong, linear? Is...
-
Let's suppose you conducted an experiment involving genetic crosses and calculated a chi square value of 1.005. There were four categories of offspring (i.e., the degrees of freedom equaled 3)....
-
For each equation: a) Tell whether the equation describes a parabola, an ellipse, or a hyperbola. b) State whether the directrix is vertical or horizontal and give its location in relation to the...
-
Given the following (one-step) transition matrices of a Markov chain, determine the classes of the Markov chain and whether they are recurrent. (a) (b) 32.3 0 0 0 213 0 0 0 10011 00-00 ta 0 1 2 3...
-
Determine the relationship between vo and vin in the circuit in figure. R1 Vin ww R22 RF
-
Golden Sun Bakery mass-produces bread using three sequential processing departments: Mixing, Baking, and Packaging. The following transactions occurred during April: Requirements: 1. Post each of...
-
Darlene Cook Company engaged in the following transactions during the month of July: July 1 Acquired land for $10,000. The company paid cash. 8 Billed customers for $3,000. This represents an...
-
ing the Question 2 Solve the following problem with branch and bound algorithm: max z = 3x1 + x2 st: 2x1 - x2 6 x1 + x2 4 x1, x2 0, xinteger
-
Exercise 6.1 Configuring Memory on Paper Objective: a computer is not performing as well as it used to. Windows 10 tool would the technician get the user to open to quickly tell how much RAM is...
-
What is a free-trade zone? Identify three techniques and provide examples of how firms and countries can benefit from having free trade zones.
-
Builtrite Diving Boards, Inc., is just paid a dividend of $1.50. If the firm's growth in dividends is expected to remain at a flat 4 percent forever, then what is the after-tax cost of common stock...
-
The total money supply M is the sum of two components: bank deposits D and cash holdings C, which we assume to bear a constant ratio C/D = c, 0 < c < 1. The high-powered money H is defined as the sum...
-
Imagine that you pay $265 for a 4-year, 4% coupon bond with par value of $265.You intend to hold the bond for 1 year.That is, you are going to buy a 4-year bond and then 1 year later, you'll sell a...
-
Please provide explanation (a) Suppose you create an equally weighted portfolio (holding weights 1/2) of 2 independent stocks (Cov (i,j)=0). What is the portfolio variance? (b) Suppose you create an...
-
Please fill out the excel sheet below completely: Cakes Sold per day Average Retail per Cake Cakes Sold per year Gross Sales (year) Rent Utilities Labor COGS (50% of Gross Sales) Total Cost Net...
-
Note: exercize one id the follwoing: Derive that the gradient of the cross entropy loss function used in binary logistic regression takes the form: ????=1/????????????=1[(????????^????????)????????]...
-
2.) Find the Laplace transform of f(t) 7e-St cos 2t +9 sinh2 2t. Use Laplace Table. %3D
-
What was the cash balance sheet amount and how much cash actually existed in the Satyams bank accounts?
-
When the fraud was revealed who took control of the company?
-
How much money was Mr. Ames earning annually?

Study smarter with the SolutionInn App