

Question: Use the flights data provided below to recreate the visualizations pictured. Recreate and organize those worksheets into the dashboard exactly as depicted below, including the
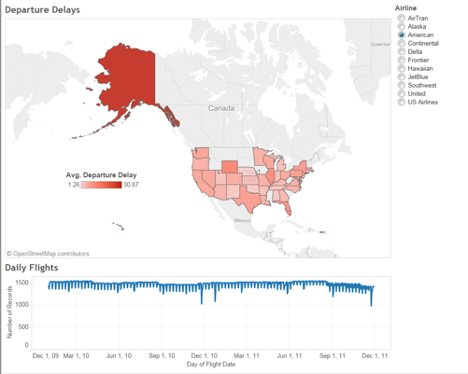
Use the flights data provided below to recreate the visualizations pictured. Recreate and organize those worksheets into the dashboard exactly as depicted below, including the selection filter on the right which must be a radio select, not a checkbox as these have two different functionalities. Note that a selection updates both the map and the line graph.
Step by Step Solution
There are 3 Steps involved in it
1 Expert Approved Answer
Step: 1 Unlock

Question Has Been Solved by an Expert!
Get step-by-step solutions from verified subject matter experts
Step: 2 Unlock
Step: 3 Unlock