

Question: Use the following information to answer the questions below: note: all sales are credit sales 2017 Income Stmt info: 2018 Sales 1,100,000 1,155,000 less Cost
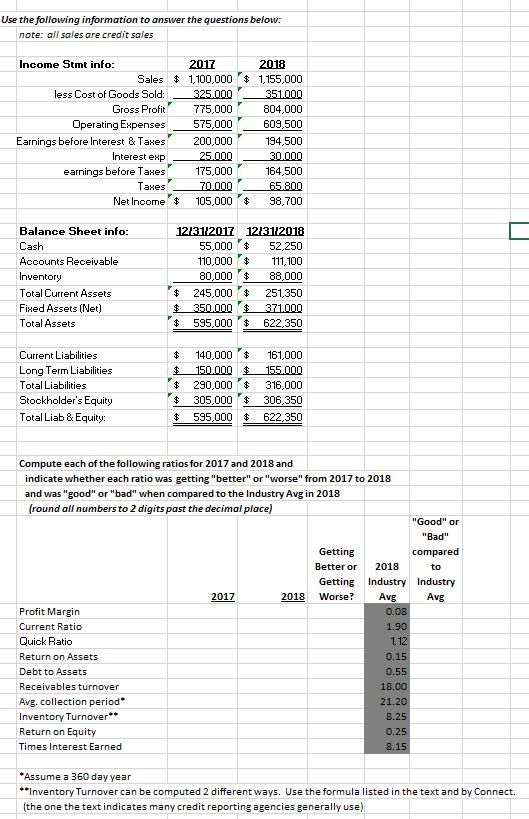
Use the following information to answer the questions below: note: all sales are credit sales 2017 Income Stmt info: 2018 Sales 1,100,000 1,155,000 less Cost of Goods Sold: 325,000 351.000 Gross Profit 775,000 804,000 Operating Expenses 609,500 575,000 Earnings before Interest & Taxes 200,000 194,500 Interest exp 25.000 30.000 164,500 175.000 earnings before Taxes es 70.000 65.800 Net Income$ 105.000 98.700 Balance Sheet info: 121311201 12/31/201 55,000 Cash $ 52,250 Accounts Receivable 110.000 $ 111,100 Inventory 80,000 $ 88,000 Total Current Assets $ 245,000 $ 251,350 350,000 Fixed Assets (Net) 371.000 Total Assets 595,000 $ 622,350 Current Liabilities 140,000 $ 161,000 150.000 $ Long Term Liabilities 155.000 316.000 Total Liabilities 290.000 Stockholder's Equity 305.000 306,350 Total Liab & Equity: 622.350 595,000 $ Compute each of the following ratios for 2017 and 2018 and indicate whether each ratio was gettingg "better" or "worse" from 2017 to 2018 and was "good" or "bad" when compared to the Industry Avg in 2018 (round all numbers to 2 digits past the decimal place) "Good" or "Bad" Getting compared Better or 2018 to Getting Industry Industry 2017 2018 Worse? Avg Avg Profit Margin 0.08 Current Ratio 1.90 Quick Ratio 1.12 Return on Assets 0.15 Debt to Assets 0.55 Receivables turnover 18.00 Avg. collection period Inventory Turnover 21.20 8.25 Return on Equity 0.25 Times Interest Earned 8.15 Assume a 360 day year Inventory Turnover can be computed 2 different ways. Use the formula listed in the text and by Connect. (the one the text indicates many credit reporting agencies generally use)
Step by Step Solution
There are 3 Steps involved in it

Get step-by-step solutions from verified subject matter experts